
Probability and Statistics for Data Science: Math + R + Data — A Practical Engineering Guide
Introduction
Data science is not simply about writing code, training machine-learning models, or creating attractive dashboards. At its core, it is about reasoning under uncertainty. Every dataset contains variation, noise, incomplete information, and patterns that may or may not be meaningful.
Probability provides a framework for describing uncertainty, while statistics provides methods for learning from observed data. R then turns these ideas into practical tools that engineers, researchers, analysts, and data scientists can apply to real problems.
For example, an engineer might ask:
- 📊 How reliable is a manufacturing process?
- 🤖 How confident should we be in a machine-learning prediction?
- 🔍 Is an observed difference between two groups meaningful?
- ⚙️ How frequently might a component fail?
- 📈 What does the distribution of sensor measurements tell us?
- 🧪 Does a new experimental method actually improve performance?
These questions require more than averages. They require an understanding of distributions, variability, sampling, inference, correlation, regression, probability, and uncertainty.


The combination of Math + R + Data creates a powerful workflow:
Mathematical concept → Statistical method → R implementation → Data interpretation → Engineering decision
R is particularly useful because it was designed around statistical computing and provides extensive tools for analysis and visualization. Modern R workflows also support reproducible data analysis and graphical exploration.
Background Theory
Why probability matters in data science
Probability describes what can happen when outcomes are uncertain.
Imagine a temperature sensor installed on an industrial machine. Its readings will not be identical every time. Even if the machine operates under apparently identical conditions, measurements can vary because of:
- sensor noise,
- environmental changes,
- measurement precision,
- operating conditions,
- random disturbances.
Probability helps describe this uncertainty.
A useful way to think about probability is:
Probability describes uncertainty before or during an observation. Statistics learns about uncertainty from observations.
This distinction is fundamental.
Why statistics matters
Statistics transforms raw observations into useful information.
Suppose an engineering team collects thousands of measurements from a production line. The raw numbers alone do not automatically reveal whether the process is stable.
Statistics can help determine:
- central tendency,
- variability,
- unusual observations,
- relationships between variables,
- differences between groups,
- confidence in estimates,
- likely future behavior.
Probability and statistics work together
A typical data-science pipeline looks like this:
Real system → Data collection → Probability model → Statistical analysis → Interpretation → Decision
This connection is especially important in machine learning because many algorithms depend directly or indirectly on statistical assumptions.
Definition
Probability
Probability is a mathematical framework for quantifying uncertainty about possible outcomes.
Its value is commonly represented between:
0 ≤ P(Event) ≤ 1
where:
- 0 represents an impossible event.
- 1 represents a certain event.
- Values between them represent different degrees of uncertainty.
Statistics
Statistics is the discipline of collecting, organizing, analyzing, interpreting, and communicating data.
It can broadly be divided into:
| Area | Purpose |
|---|---|
| Descriptive statistics | Summarize observed data |
| Inferential statistics | Draw conclusions about a larger population |
| Probability theory | Model uncertainty |
| Regression | Study relationships between variables |
| Hypothesis testing | Evaluate statistical claims |
| Statistical modeling | Represent data-generating processes |
Population and sample
A population is the complete group of interest.
A sample is a subset observed from that population.
For example:
Population: Every manufactured bearing from a production facility.
Sample: 500 bearings selected for quality testing.
The goal is often to use the sample to learn something reliable about the population.
Step-by-Step: From Data to Statistical Insight
Step 1: Define the engineering question
Never begin with a statistical test simply because software makes it available.
Start with the question.
For example:
Does changing the cooling configuration reduce average operating temperature?
This question determines what data should be collected.
Step 2: Identify the variables
Possible variables include:
- cooling configuration,
- operating temperature,
- machine load,
- ambient temperature,
- operating duration.
Variables should be clearly defined before analysis begins.
Step 3: Collect and inspect the data
Data may come from:
- sensors,
- laboratory experiments,
- databases,
- surveys,
- simulations,
- production systems,
- financial records,
- web applications.
Before performing advanced analysis, inspect the data for missing values, duplicates, impossible measurements, and inconsistent units.
Step 4: Explore the distribution
A histogram can reveal whether values are concentrated, spread out, skewed, or affected by unusual observations.
R makes this exploration relatively straightforward, particularly with tools such as ggplot2, which provides a systematic grammar for constructing visualizations.


Step 5: Summarize the data
Useful summaries include:
- mean,
- median,
- minimum,
- maximum,
- standard deviation,
- quartiles,
- interquartile range.
The correct summary depends on the shape of the data.
For strongly skewed data, the median may communicate the typical observation more effectively than the mean.
Step 6: Model uncertainty
Probability distributions can help describe possible data behavior.
Common examples include:
- Normal distribution,
- Binomial distribution,
- Poisson distribution,
- Exponential distribution,
- Uniform distribution,
- Student’s t-distribution.
The choice should be based on the data-generating process rather than convenience.
Step 7: Perform statistical inference
When a sample is used to learn about a population, uncertainty must be acknowledged.
Common tools include:
- confidence intervals,
- hypothesis tests,
- regression models,
- resampling,
- Bayesian methods.
Step 8: Interpret the engineering meaning
The final question is not:
“What did R calculate?”
It is:
“What does this result mean for the real system?”
That distinction separates mechanical statistical computation from effective data science.
Probability Distributions and Their Role
Discrete distributions
Discrete distributions describe outcomes that can be counted.
Examples include:
Bernoulli: one trial with two possible outcomes.
Binomial: number of successes across repeated binary trials.
Poisson: number of events occurring within a specified interval under appropriate assumptions.
These models can appear in applications such as defect counts, system events, arrivals, or successful outcomes.
Continuous distributions
Continuous distributions describe measurements that can take values across an interval.
Examples include:
- Normal,
- Uniform,
- Exponential,
- Gamma,
- Log-normal.

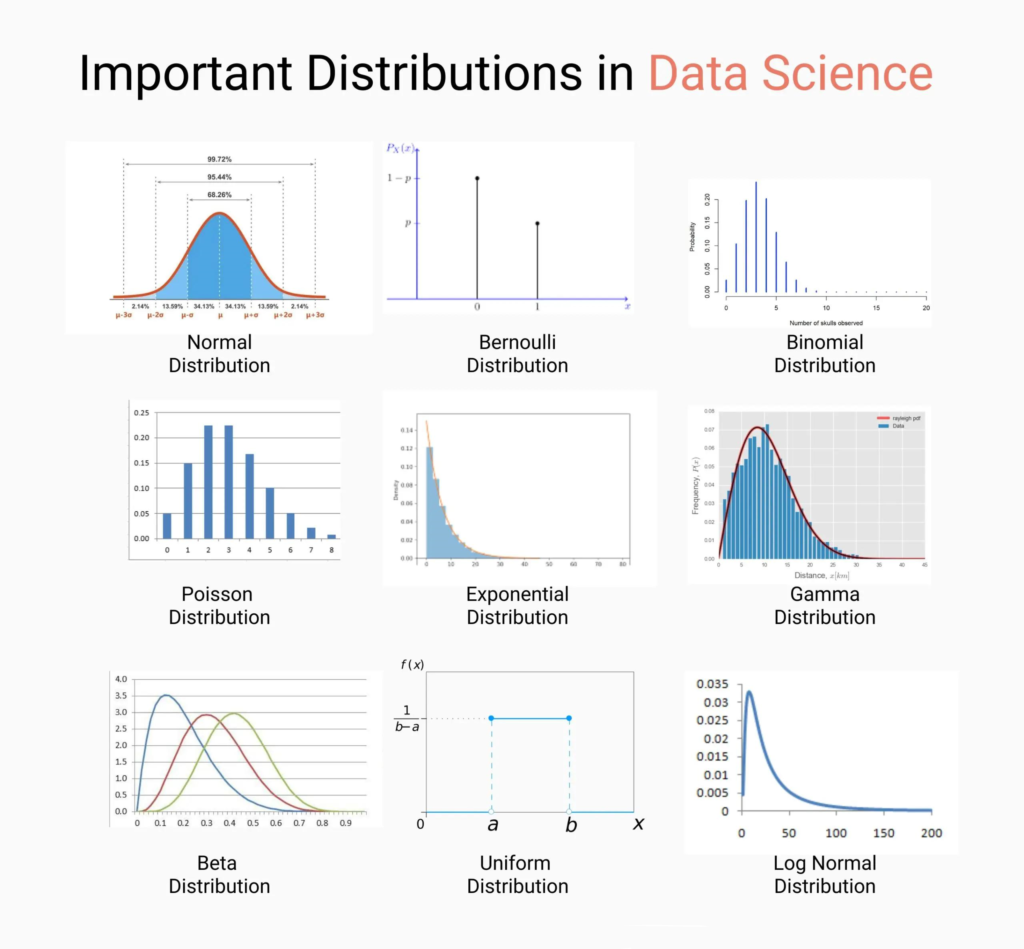

The Normal distribution
The Normal distribution is widely used because many measurement processes can be approximately described by it under appropriate conditions.
However, engineers should avoid automatically assuming that every dataset is Normal.
Real-world data may be:
- skewed,
- multimodal,
- heavy-tailed,
- truncated,
- bounded,
- time-dependent.
Math + R + Data: The Complete Connection
Mathematical layer
The mathematical layer provides concepts such as:
P(A) → probability of event A
E(X) → expected value
Var(X) → variance
σ → standard deviation
μ → population mean
x̄ → sample mean
ρ → population correlation
These symbols help communicate statistical ideas precisely.
R programming layer
R converts statistical concepts into reproducible computational procedures.
For example, an analyst can use R to:
- calculate descriptive statistics,
- simulate random processes,
- generate distributions,
- create confidence intervals,
- perform hypothesis tests,
- fit regression models,
- visualize results.
Data layer
The data layer is where theory meets reality.
A statistically elegant model can still produce misleading conclusions if the underlying data are:
❌ biased
❌ incomplete
❌ poorly measured
❌ incorrectly labeled
❌ non-representative
Therefore:
Good mathematics + bad data = bad conclusion.
Comparison: Probability vs Statistics vs Data Science
| Feature | Probability | Statistics | Data Science |
|---|---|---|---|
| Main focus | Uncertainty | Learning from data | End-to-end data problems |
| Starting point | Possible outcomes | Observed data | Data + business/engineering problem |
| Main question | What could happen? | What does the data suggest? | What should we understand or predict? |
| Typical tools | Distributions | Inference and modeling | Statistics + programming + ML |
| R usage | Simulation and distributions | Analysis and inference | Complete analytical workflow |
| Engineering value | Risk modeling | Evidence-based decisions | Prediction and optimization |
R vs Python for statistics
R and Python are both powerful data-science technologies.
| R | Python |
|---|---|
| Strong statistical heritage | General-purpose programming ecosystem |
| Excellent statistical packages | Strong machine-learning ecosystem |
| Powerful visualization | Strong integration with software systems |
| Excellent research workflows | Excellent production applications |
| Very popular in statistics | Very popular across AI and engineering |
The choice does not have to be ideological. Many professionals use both.
Diagrams and Statistical Workflow
Data-science statistical pipeline
┌──────────────────────┐
│ Engineering Question│
└──────────┬───────────┘
           ↓
┌──────────────────────┐
│   Data Collection    │
└──────────┬───────────┘
           ↓
┌──────────────────────┐
│ Data Cleaning & QA   │
└──────────┬───────────┘
           ↓
┌──────────────────────┐
│ Exploratory Analysis │
└──────────┬───────────┘
           ↓
┌──────────────────────┐
│ Probability / Model  │
└──────────┬───────────┘
           ↓
┌──────────────────────┐
│ Statistical Inference│
└──────────┬───────────┘
           ↓
┌──────────────────────┐
│ Engineering Decision │
└──────────────────────┘
Statistical thinking hierarchy
                DATA
                 │
                 ▼
          DESCRIPTIVE STATS
                 │
                 ▼
        PROBABILITY MODELS
                 │
                 ▼
        STATISTICAL INFERENCE
                 │
                 ▼
       PREDICTION / DECISION


Examples
Example 1: Manufacturing quality
A factory records measurements from a production line.
The data scientist discovers that most products fall within the desired range, but occasional extreme values appear.
Probability and statistics can help determine whether these extreme values represent:
- random variation,
- measurement errors,
- machine deterioration,
- material changes,
- or a genuine process problem.
Example 2: Website performance
An engineering team measures page-loading times.
Instead of reporting only the average, analysts examine:
- median response time,
- high-percentile latency,
- variability,
- unusual spikes,
- differences between geographic regions.
This provides a much more realistic picture of user experience.
Example 3: Machine learning
A classification model predicts whether an industrial component requires inspection.
The model may produce a probability rather than a simple yes/no result.
An engineering team can then select an appropriate decision threshold based on the cost of:
- false alarms,
- missed failures,
- unnecessary inspections.
Real-World Applications
Engineering reliability
Probability models can estimate the likelihood of component failures and support maintenance planning.
Industrial process control
Statistical process control helps engineers monitor manufacturing variation and detect unusual process behavior.
Artificial intelligence
Machine-learning systems rely heavily on statistical concepts such as probability distributions, estimation, sampling, uncertainty, and optimization.
Healthcare analytics
Statistical models can support research studies, risk analysis, and population-level investigations.
Financial technology
Probability and statistics are used for:
- risk analysis,
- forecasting,
- fraud detection,
- portfolio modeling,
- credit assessment.
Environmental engineering
Engineers can analyze rainfall, temperature, pollution, water quality, and extreme events using statistical models.
Telecommunications
Probability models help analyze network traffic, failures, congestion, and service reliability.
Common Mistakes
Confusing correlation with causation
Two variables can move together without one causing the other.
A correlation is evidence of an association—not automatically evidence of causality.
Using the mean for every dataset
Averages can be strongly influenced by extreme values.
Always inspect the distribution before deciding how to summarize the data.
Ignoring sample bias
A large dataset is not necessarily a representative dataset.
Millions of biased observations can still produce a biased conclusion.
Treating statistical significance as practical importance
A tiny effect may become statistically detectable with a sufficiently large sample.
Engineers should ask whether the effect is practically meaningful.
Overfitting
A model can perform extremely well on existing data while failing on new observations.
Always distinguish between training performance and generalization.
Ignoring missing data
Missing observations may contain information about the system itself.
Simply deleting missing records can introduce bias.
Choosing a distribution automatically
Do not assume that data follow a Normal distribution simply because it is familiar.
Explore the data and understand the mechanism generating the observations.
Challenges and Solutions
| Challenge | Potential Solution |
|---|---|
| Missing data | Investigate why data are missing before selecting an approach |
| Outliers | Verify whether they are errors or genuine observations |
| Small samples | Use appropriate uncertainty estimates and cautious interpretation |
| Biased sampling | Improve the sampling design |
| Non-normal data | Consider suitable transformations or alternative models |
| Confounding variables | Use experimental design or multivariable modeling |
| Overfitting | Use validation and independent test data |
| Poor visualization | Match the chart to the analytical question |
| Reproducibility problems | Document code, data preparation, and assumptions |
Case Study: Predicting Equipment Failure Risk
Problem
Consider a manufacturing facility containing hundreds of industrial pumps.
Each pump generates information such as:
- operating temperature,
- vibration level,
- pressure,
- operating hours,
- maintenance history,
- previous failures.
The engineering team wants to identify pumps that may require inspection.
Data exploration
The team first investigates the distributions of the sensor variables.
They discover that vibration measurements are highly variable and that some machines have unusually high values.
Instead of immediately deleting those observations, engineers investigate them.
Several extreme measurements correspond to genuine mechanical problems.
Statistical modeling
The team then builds a statistical model linking sensor behavior with historical failure events.
Probability estimates allow the system to rank equipment according to estimated risk.
Engineering decision
Instead of waiting for a pump to fail, maintenance engineers can prioritize inspections for machines showing unusual combinations of indicators.
The result is not simply a statistical prediction.
It becomes an operational workflow:
Sensor → Data → Statistical model → Risk estimate → Inspection → Maintenance
Lesson
The most valuable part of the project is not the sophistication of the algorithm.
It is the connection between:
Reliable data + statistical reasoning + engineering knowledge + practical action.
Essential Tips
Build intuition before memorizing formulas
Understanding what a distribution represents is more valuable than memorizing its equation.
Always visualize data
A graph can reveal skewness, clusters, outliers, and relationships that summary statistics hide.
Learn R through real datasets
Instead of practicing only artificial examples, analyze datasets related to engineering, business, science, or technology.
Understand assumptions
Every statistical method has assumptions.
Ask:
- Is the sample representative?
- Are observations independent?
- Is the measurement reliable?
- Is the selected model appropriate?
Separate exploration from confirmation
Exploratory analysis helps discover patterns.
Confirmatory analysis evaluates predefined questions more rigorously.
Report uncertainty
Avoid presenting estimates as absolute facts.
Use appropriate uncertainty measures and explain what they mean.
Combine statistical and domain knowledge
A statistician may identify an unusual pattern, but an engineer may know why it occurs.
The strongest data-science decisions combine both perspectives.
Make your R analysis reproducible
Keep:
- raw data,
- cleaned data,
- scripts,
- documentation,
- visualizations,
- model results
organized so another analyst can understand and reproduce the workflow.
FAQs
What is the difference between probability and statistics?
Probability generally starts with assumptions about uncertainty and asks what outcomes might occur. Statistics starts with observed data and attempts to learn about the underlying population or process.
Is probability and statistics important for data science?
Yes. They provide the foundation for understanding uncertainty, sampling, distributions, inference, experiments, regression, machine learning, and model evaluation.
Is R good for statistical analysis?
Yes. R was developed around statistical computing and has a broad ecosystem for statistical analysis, visualization, modeling, and reproducible research.
Do I need advanced mathematics to learn statistics for data science?
Not necessarily. Beginners can start with descriptive statistics, probability concepts, distributions, sampling, and visualization. More advanced mathematical knowledge becomes increasingly useful for statistical modeling and machine learning.
Should I learn R or Python first?
Either can work. If your primary goal is statistical analysis, research, and visualization, R is an excellent choice. If your goal includes broader software development and machine learning engineering, Python is also highly valuable.
What probability distributions should a beginner learn?
Start with Bernoulli, Binomial, Normal, Uniform, Poisson, and Exponential distributions. Later, study distributions such as Gamma, Beta, Log-normal, and Student’s t when your applications require them.
Why is data visualization important in statistics?
Visualization helps reveal patterns, distributions, relationships, and unusual observations. R provides multiple visualization systems, including base graphics and ggplot2.
Can probability and statistics improve machine-learning models?
Absolutely. Statistical thinking helps with data sampling, feature analysis, uncertainty, model evaluation, experimental design, overfitting, and interpretation of predictions.
Conclusion
Probability and statistics form the reasoning engine behind modern data science.
Probability provides a language for uncertainty. Statistics provides methods for learning from observations. R provides a practical environment for transforming those concepts into reproducible analysis.
The real power appears when the three are connected:
📐 Math → 💻 R → 📊 Data → 🧠 Insight → ⚙️ Engineering Decision
For beginners, the journey should start with descriptive statistics, probability, distributions, visualization, and basic R programming.
For advanced students and professionals, the path can progress toward statistical inference, regression, resampling, Bayesian analysis, experimental design, time-series modeling, and machine learning.
The most important lesson is simple:
Data science is not about finding numbers—it is about understanding what those numbers mean.
When mathematical reasoning, statistical discipline, programming, and domain expertise work together, raw observations become reliable evidence for engineering and scientific decisions.




