Practical Business Analytics Using R and Python 2nd Edition: A Complete Guide to Data-Driven Business Decision Making 📊🐍
Introduction 🚀
Business analytics has become one of the most valuable disciplines in today’s digital economy. Organizations across the United States, United Kingdom, Canada, Australia, and Europe increasingly rely on data-driven strategies to improve efficiency, predict customer behavior, optimize operations, and maximize profitability.
Practical Business Analytics Using R and Python (2nd Edition) introduces readers to modern analytical techniques using two of the world’s most popular programming languages for analytics: R and Python. Instead of focusing only on theory, the book emphasizes practical implementation through real datasets, business problems, and reproducible workflows.
Whether you are a university student learning analytics for the first time, an engineer exploring data science, or a business professional seeking competitive advantages, understanding both R and Python provides a powerful toolkit for solving real organizational challenges.
Throughout this guide, you’ll learn:
- 📊 Business analytics fundamentals
- 🐍 Python analytics workflows
- 📈 R statistical modeling
- 🤖 Machine learning basics
- 💼 Business intelligence concepts
- 🔍 Predictive analytics
- 📉 Data visualization
- ⚡ Optimization techniques
- 📚 Practical examples
- 🚀 Industry applications


Background Theory 📚
Business analytics combines mathematics, statistics, computer science, economics, and domain expertise to transform raw data into actionable business intelligence.
The discipline evolved from traditional reporting systems into sophisticated predictive and prescriptive analytics powered by machine learning and artificial intelligence.
Modern analytics generally includes four major categories:
Descriptive Analytics
Answers:
- What happened?
- How many sales occurred?
- Which products performed best?
Examples include dashboards, reports, KPIs, and historical summaries.
Diagnostic Analytics
Answers:
- Why did sales decrease?
- What caused customer churn?
- Which factors influenced production costs?
This stage focuses on identifying root causes.
Predictive Analytics
Uses historical information to estimate future outcomes.
Examples:
- Sales forecasting
- Customer lifetime value prediction
- Equipment failure prediction
- Fraud detection
Prescriptive Analytics
Provides recommendations rather than predictions.
Examples include:
- Inventory optimization
- Delivery route optimization
- Marketing budget allocation
- Dynamic pricing
Definition 📖
Business analytics is the systematic process of collecting, cleaning, analyzing, visualizing, and modeling data to support informed business decisions.
Using R and Python allows analysts to automate this entire process through programming, statistical modeling, visualization libraries, and machine learning algorithms.
Step-by-Step Business Analytics Workflow 🛠️


Step 1 — Business Problem Definition 🎯
Before writing any code, clearly define the objective.
Examples:
- Increase sales
- Reduce customer churn
- Predict maintenance
- Improve marketing ROI
Without a clearly defined problem, analytics becomes directionless.
Step 2 — Data Collection 📥
Typical sources include:
- SQL databases
- Excel spreadsheets
- CSV files
- APIs
- ERP systems
- CRM software
- IoT sensors
- Web analytics
Python libraries:
- pandas
- requests
- SQLAlchemy
R packages:
- readr
- DBI
- httr
Step 3 — Data Cleaning 🧹
Raw data often contains:
- Missing values
- Duplicate records
- Incorrect formats
- Outliers
- Typographical errors
Cleaning may consume over 70% of a real analytics project.
Step 4 — Exploratory Data Analysis 🔍
EDA helps discover:
- Trends
- Correlations
- Seasonal patterns
- Distributions
- Anomalies
Visualization libraries include:
Python:
- Matplotlib
- Seaborn
- Plotly
R:
- ggplot2
- lattice
- plotly
Step 5 — Feature Engineering ⚙️
Transform raw variables into meaningful predictors.
Examples:
- Customer age groups
- Purchase frequency
- Average transaction value
- Rolling averages
- Lag variables
Step 6 — Statistical Modeling 📊
Models may include:
- Linear regression
- Logistic regression
- ANOVA
- Time-series forecasting
- Hypothesis testing
Step 7 — Machine Learning 🤖
Common algorithms include:
- Decision Trees
- Random Forest
- XGBoost
- Neural Networks
- Support Vector Machines
- K-Means Clustering
Step 8 — Model Evaluation ✅
Typical metrics:
- Accuracy
- Precision
- Recall
- RMSE
- MAE
- ROC-AUC
Step 9 — Business Reporting 📈
Results should be presented through:
- Interactive dashboards
- Executive reports
- Visual storytelling
- KPI monitoring
R vs Python Comparison ⚖️
| Feature | R | Python |
|---|---|---|
| Learning Curve | Moderate | Easy |
| Statistics | Excellent | Excellent |
| Machine Learning | Excellent | Excellent |
| Business Reporting | Excellent | Very Good |
| Automation | Good | Excellent |
| Data Visualization | Outstanding | Outstanding |
| AI Development | Good | Excellent |
| Community Support | Large | Very Large |
| Enterprise Adoption | High | Extremely High |
| Web Integration | Moderate | Excellent |
Analytics Architecture, Tables & Diagrams 🏗️
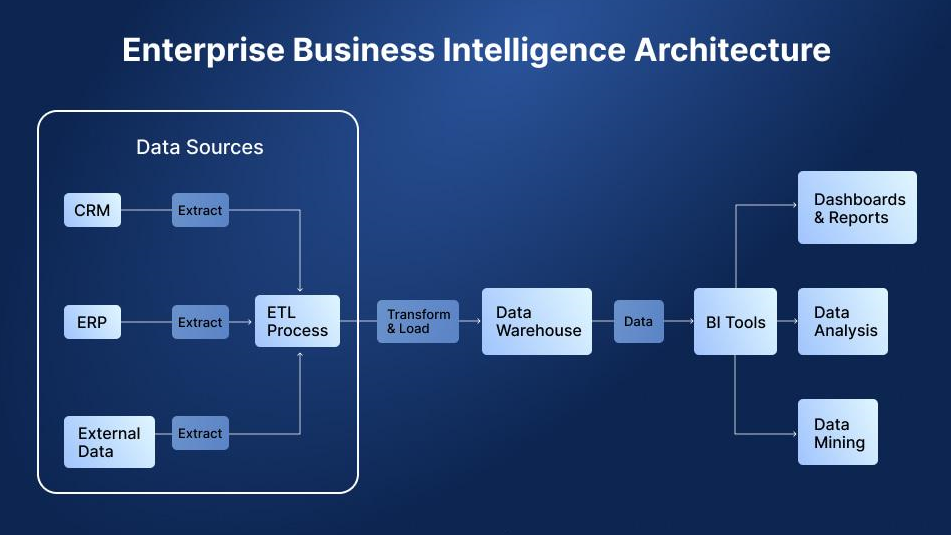


Typical Analytics Pipeline
| Stage | Input | Output |
|---|---|---|
| Data Collection | Databases | Raw Data |
| Cleaning | Raw Data | Clean Dataset |
| Exploration | Dataset | Insights |
| Modeling | Features | Predictions |
| Visualization | Results | Dashboards |
| Decision Making | Analytics | Business Actions |
Business Analytics Technology Stack
| Layer | Technologies |
|---|---|
| Programming | Python, R |
| Database | SQL |
| Visualization | Power BI, Tableau |
| ML Libraries | Scikit-learn, TensorFlow |
| Statistical Packages | tidyverse, caret |
| Cloud | Azure, AWS, Google Cloud |
Typical Workflow
Business Problem
        ↓
Collect Data
        ↓
Clean Data
        ↓
Explore Data
        ↓
Build Model
        ↓
Evaluate Model
        ↓
Deploy Solution
        ↓
Monitor Results
Practical Examples 💡
Example 1 — Sales Forecasting
A retail company uses five years of sales history.
Python applies time-series forecasting to estimate monthly revenue.
Managers optimize inventory before seasonal demand increases.
Example 2 — Customer Churn Prediction
A telecom provider analyzes:
- Customer tenure
- Monthly charges
- Contract type
- Support tickets
Machine learning predicts customers likely to leave.
Marketing targets retention campaigns.
Example 3 — Manufacturing Quality
An engineering company monitors:
- Temperature
- Pressure
- Machine vibration
- Production speed
Analytics identifies defect patterns before products fail inspection.
Example 4 — Banking Risk Assessment
Banks analyze:
- Credit history
- Income
- Loan amount
- Payment behavior
Predictive models estimate default probability.
Real-World Applications 🌍
Business analytics is transforming nearly every industry.
Manufacturing
- Predictive maintenance
- Quality inspection
- Process optimization
- Production scheduling
Healthcare
- Patient risk prediction
- Hospital resource planning
- Medical imaging analysis
- Disease forecasting
Finance
- Fraud detection
- Credit scoring
- Portfolio optimization
- Investment analytics
Retail
- Demand forecasting
- Customer segmentation
- Dynamic pricing
- Inventory management
Logistics
- Route optimization
- Warehouse automation
- Fleet management
- Delivery prediction
Energy
- Smart grids
- Load forecasting
- Renewable optimization
- Equipment monitoring
Common Mistakes ❌
Many beginners repeat the same errors.
Ignoring Data Quality
Poor data leads to unreliable predictions.
Using Complex Models Too Early
Simple regression often outperforms complicated neural networks for structured business data.
Overfitting
A model memorizes historical data instead of learning meaningful patterns.
Ignoring Business Objectives
High model accuracy means little if the solution does not address the original business problem.
Poor Visualization
Overcrowded charts confuse stakeholders.
Simple visualizations communicate insights more effectively.
Challenges & Solutions ⚙️
| Challenge | Solution |
|---|---|
| Missing Data | Imputation methods |
| Large Datasets | Distributed computing |
| Imbalanced Classes | SMOTE, class weighting |
| Feature Selection | Correlation analysis |
| Data Privacy | Encryption and anonymization |
| Model Drift | Continuous monitoring |
| Poor Interpretability | SHAP, LIME explanations |
Case Study 🏢
Retail Chain Sales Optimization
A multinational retailer struggled with inconsistent inventory across hundreds of stores.
Problem
Some locations experienced stock shortages.
Others accumulated unsold inventory.
Solution
Using R and Python, analysts:
- Cleaned three years of transaction data
- Built demand forecasting models
- Clustered stores by purchasing behavior
- Automated replenishment schedules
Results
- 📈 22% reduction in stock shortages
- 💰 15% inventory cost savings
- 🚚 Faster supply chain decisions
- 😊 Higher customer satisfaction
- 📊 Better executive reporting
This case demonstrates how analytics converts raw operational data into measurable business value.
Essential Tips ⭐
- 🎯 Start with a clearly defined business question.
- 📊 Always explore your data before modeling.
- 🧹 Spend sufficient time cleaning datasets.
- 🐍 Learn both Python and R instead of relying on only one language.
- 📈 Create simple, informative visualizations.
- 🤖 Compare multiple algorithms before selecting a final model.
- 🔄 Continuously retrain predictive models with new data.
- 📚 Document every analytical step for reproducibility.
- 💼 Focus on business impact rather than algorithm complexity.
- 🚀 Practice using real-world datasets whenever possible.
Frequently Asked Questions ❓
Is Python better than R?
Python excels in automation, machine learning, and software integration, while R remains exceptional for advanced statistical analysis and research. Learning both offers maximum flexibility.
Can beginners learn business analytics?
Yes. Beginners can start with spreadsheets, SQL, Python, and R before progressing to machine learning and advanced analytics.
Is coding mandatory?
Programming significantly improves productivity and enables scalable analysis, although some visual analytics tools require minimal coding.
Which industries hire business analysts?
Finance, healthcare, engineering, retail, manufacturing, government, telecommunications, logistics, insurance, consulting, and technology all employ business analytics professionals.
How long does it take to become proficient?
With consistent practice, foundational skills can be developed within several months. Mastery of advanced analytics, machine learning, and domain expertise typically takes longer and benefits from real project experience.
Should I learn SQL alongside R and Python?
Absolutely. SQL is essential for retrieving and managing data stored in relational databases, making it a core skill for analytics professionals.
What software is commonly used?
Popular tools include RStudio, Visual Studio Code, Jupyter Notebook, Power BI, Tableau, Microsoft Excel, and cloud platforms such as AWS, Azure, and Google Cloud.
Conclusion 🎯
Business analytics has become a cornerstone of modern decision-making, empowering organizations to transform vast amounts of data into meaningful insights and strategic actions. Practical Business Analytics Using R and Python (2nd Edition) provides a balanced, hands-on approach by combining statistical rigor with practical programming skills, making it valuable for both newcomers and experienced professionals.
By mastering data collection, cleaning, exploration, statistical analysis, predictive modeling, visualization, and machine learning with R and Python, readers gain the ability to solve real business problems across industries such as manufacturing, healthcare, finance, retail, logistics, and energy. These skills not only improve operational efficiency but also support innovation, risk reduction, and sustainable competitive advantage.
As data continues to grow in volume and importance, professionals who can bridge business knowledge with analytical expertise will remain in high demand. Investing time in learning practical business analytics today prepares students, engineers, analysts, and decision-makers to thrive in the increasingly data-driven world of tomorrow. 📊🚀