
Data Mining and Predictive Analytics 2nd Edition: A Practical Guide to Turning Data into Future Insights
Introduction
Every day, organizations generate enormous amounts of data through websites, mobile applications, sensors, financial transactions, social media, industrial equipment, healthcare systems, and customer interactions. However, raw data has limited value until it can be transformed into meaningful information. This is where data mining and predictive analytics become powerful engineering and analytical tools. 📊🤖
Data mining focuses on discovering hidden patterns, relationships, trends, and anomalies within large datasets. Predictive analytics takes those discoveries further by using historical information and statistical or machine-learning techniques to estimate what may happen in the future.


These technologies are now important across engineering, manufacturing, finance, transportation, energy, retail, telecommunications, cybersecurity, and scientific research. For students, they provide a foundation for understanding modern data-driven systems. For professionals, they can support better forecasting, preventive maintenance, risk management, and operational decision-making.
The fundamental idea is simple:
Raw Data → Data Mining → Patterns → Predictive Model → Forecast → Decision → Action 🚀
The challenge is making each stage reliable. Poor-quality data can produce misleading patterns, while an inappropriate predictive model can generate inaccurate forecasts. Therefore, successful predictive analytics requires much more than simply applying a machine-learning algorithm.
Background Theory
From Raw Data to Useful Knowledge
Data mining emerged from the growing need to analyze datasets that became too large and complex for traditional manual analysis.
Traditional analysis might examine a limited number of records using spreadsheets or conventional databases. Modern organizations, however, can collect millions or billions of observations.
Examples include:
- Manufacturing sensor readings
- Online purchasing records
- Vehicle telemetry
- Energy consumption
- Website activity
- Banking transactions
- Equipment maintenance logs
- Customer support interactions
- Scientific measurements
Data mining provides techniques for discovering useful structures within these datasets.
Predictive analytics then uses historical patterns to estimate future outcomes.
The Role of Statistics and Machine Learning
Predictive analytics combines concepts from several technical disciplines, including:
- Statistics
- Probability
- Machine learning
- Database systems
- Artificial intelligence
- Data visualization
- Optimization
- Domain-specific engineering knowledge
A predictive system may use relatively simple statistical methods or advanced machine-learning algorithms.
For example, a manufacturing organization might analyze historical machine measurements to identify conditions associated with equipment failures. A predictive model could then estimate which machines are likely to require maintenance.
Descriptive, Diagnostic, Predictive, and Prescriptive Analytics
Analytics can be divided into four closely related categories.
| Analytics Type | Main Question | Example |
|---|---|---|
| Descriptive | What happened? | Production decreased last month |
| Diagnostic | Why did it happen? | A machine experienced repeated interruptions |
| Predictive | What may happen next? | Another interruption may occur soon |
| Prescriptive | What should we do? | Schedule preventive maintenance |
Data mining often supports the transition from descriptive and diagnostic analysis toward predictive and prescriptive decision-making.
Definition
What Is Data Mining?
Data mining is the systematic process of examining large datasets to discover meaningful patterns, relationships, trends, anomalies, and useful information.
It may involve techniques such as:
- Classification
- Clustering
- Association analysis
- Anomaly detection
- Feature selection
- Pattern recognition
- Sequential analysis
The objective is not simply to find patterns. The patterns must be useful, interpretable, and relevant to the problem being investigated.
What Is Predictive Analytics?
Predictive analytics is the use of historical data, statistical techniques, and computational models to estimate future events, behaviors, or outcomes.
Predictive analytics does not guarantee the future. Instead, it produces an informed estimate based on available evidence.
This distinction is important.
A predictive model saying that a machine has a high probability of failure does not mean the machine will definitely fail. Engineers must consider uncertainty, operating conditions, sensor quality, and other factors.
Relationship Between Data Mining and Predictive Analytics
Data mining and predictive analytics overlap but are not identical.
Data mining can discover previously unknown relationships, while predictive analytics focuses specifically on estimating future or unknown outcomes.
A simplified workflow is:
Data Collection → Cleaning → Exploration → Mining → Feature Engineering → Modeling → Validation → Prediction → Monitoring
Step-by-Step Explanation
Step 1: Define the Problem
Before collecting data, clearly define the engineering or business problem.
Instead of asking:
“What can we discover from this dataset?”
ask:
“What decision are we trying to improve?”
For example:
Problem: Predict unexpected failures in industrial pumps.
Objective: Identify equipment showing warning signs early enough to schedule maintenance.
A clear objective prevents unnecessary analysis.
Step 2: Collect Relevant Data
Data may originate from:
- Sensors
- Databases
- APIs
- Transaction systems
- Logs
- Surveys
- Laboratory instruments
- Cloud platforms
- IoT devices
The data must be relevant to the problem.
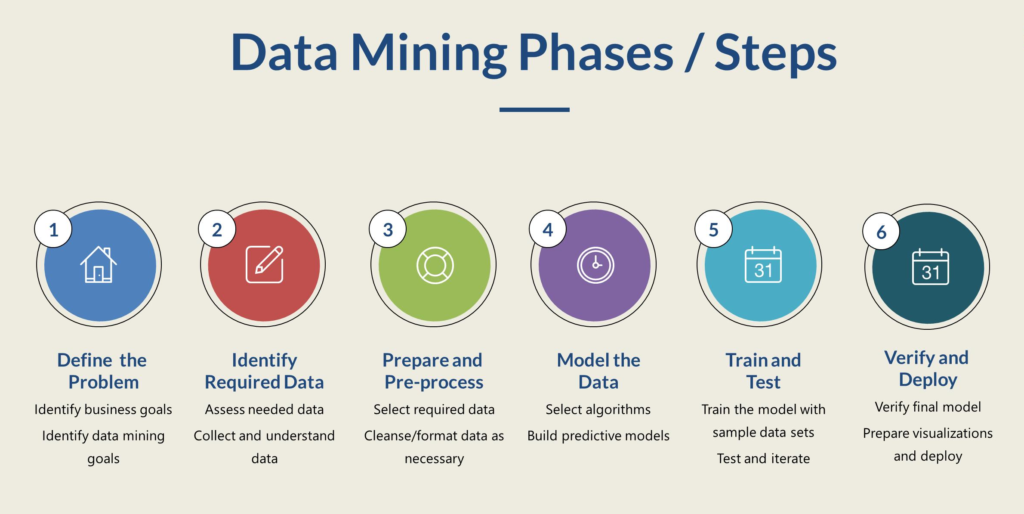


Step 3: Clean the Data
Real-world datasets are rarely perfect.
They may contain:
- Missing values
- Duplicate records
- Incorrect measurements
- Inconsistent formats
- Extreme values
- Sensor errors
- Incorrect labels
Data cleaning can have a greater impact on the final result than selecting a sophisticated algorithm.
Step 4: Explore the Dataset
Exploratory analysis helps engineers understand what the data contains.
Useful questions include:
- Which variables are strongly related?
- Are there unusual observations?
- Are some categories poorly represented?
- Are measurements changing over time?
- Are there obvious data-quality problems?
Visualization is especially useful during this stage. 📈
Step 5: Discover Patterns
Data mining algorithms can now search for useful structures.
For example, clustering could group customers according to purchasing behavior, while anomaly detection could identify unusual machine operation.
Step 6: Select Features
A feature is a measurable characteristic used by an analytical model.
For an industrial machine, potential features could include:
- Temperature
- Vibration
- Pressure
- Operating hours
- Load
- Speed
- Maintenance history
Selecting meaningful features can improve model performance and interpretability.
Step 7: Build a Predictive Model
Different problems require different approaches.
Common predictive techniques include:
- Linear and logistic models
- Decision trees
- Random forests
- Gradient boosting
- Neural networks
- Support vector machines
- Time-series models
The simplest suitable model is often a good starting point.
Step 8: Validate the Model
A model should be evaluated using data that was not used to train it.
Common evaluation measures include:
- Accuracy
- Precision
- Recall
- F1 score
- Mean absolute error
- Root mean squared error
- Area under the ROC curve
The correct metric depends on the application.
Step 9: Deploy and Monitor
A predictive model is not finished when training ends.
Real-world data changes over time. Equipment ages, customers change behavior, markets evolve, and sensors can be replaced.
Therefore, deployed models require continuous monitoring. 🔍
Comparison
Data Mining vs Predictive Analytics
| Feature | Data Mining | Predictive Analytics |
|---|---|---|
| Primary objective | Discover patterns | Predict outcomes |
| Main focus | Existing data | Future or unknown outcomes |
| Typical output | Relationships and groups | Predictions or risk estimates |
| Common techniques | Clustering, association, anomaly detection | Classification, regression, forecasting |
| Main question | What patterns exist? | What is likely to happen? |
| Engineering use | Discover abnormal operating behavior | Predict equipment failure |
Traditional Analysis vs Predictive Analytics
Traditional analysis often explains what has already happened.
Predictive analytics attempts to provide an early warning about what could happen next.
For engineering organizations, this shift can be extremely valuable because early information can support preventive action.
Diagrams & Tables
Predictive Analytics Architecture
 ┌─────────────────┐
 │ Data Sources    │
 │ Sensors / Logs  │
 │ Databases / IoT │
 └────────┬────────┘
          ↓
 ┌─────────────────┐
 │ Data Collection │
 └────────┬────────┘
          ↓
 ┌─────────────────┐
 │ Data Cleaning   │
 └────────┬────────┘
          ↓
 ┌─────────────────┐
 │ Data Mining     │
 └────────┬────────┘
          ↓
 ┌─────────────────┐
 │ ML Model        │
 └────────┬────────┘
          ↓
 ┌─────────────────┐
 │ Prediction      │
 └────────┬────────┘
          ↓
 ┌─────────────────┐
 │ Engineering     │
 │ Decision        │
 └─────────────────┘
Common Data Mining Techniques
| Technique | Purpose | Example |
|---|---|---|
| Classification | Assign categories | Fault / normal |
| Clustering | Discover groups | Customer segments |
| Association | Find relationships | Products purchased together |
| Anomaly detection | Find unusual behavior | Fraudulent transaction |
| Regression | Predict continuous values | Energy demand |
| Time-series analysis | Study temporal patterns | Equipment temperature trend |


Examples
Manufacturing Example
A factory collects vibration and temperature information from electric motors.
Historical maintenance records show that certain combinations of vibration changes and temperature increases frequently occur before motor problems.
A data mining system identifies these patterns.
A predictive model then monitors new measurements and alerts engineers when similar behavior appears.
The maintenance team can inspect the motor before an unexpected shutdown.
Retail Example
An online retailer analyzes purchasing histories.
Data mining identifies groups of customers with similar shopping behavior.
Predictive analytics can estimate which customers may be interested in particular product categories.
The company can then improve recommendations and inventory planning.
Energy Example
An energy company analyzes historical consumption patterns, weather information, and operational data.
Predictive analytics can estimate future electricity demand.
This information can help operators plan generation and reduce the risk of supply problems.
Real-World Applications
Predictive Maintenance
Predictive maintenance is one of the most important industrial applications.
Instead of maintaining equipment only according to a fixed schedule, organizations can use sensor information to estimate equipment condition.
Potential benefits include:
- Reduced downtime
- Better maintenance planning
- Improved equipment availability
- Reduced emergency repairs
- Longer equipment life
Transportation
Transportation systems generate huge quantities of data.
Predictive analytics can support:
- Vehicle maintenance
- Traffic forecasting
- Fleet optimization
- Route planning
- Component monitoring
Financial Engineering
Financial institutions use data mining to identify unusual transaction behavior, evaluate risk, and support forecasting.
However, financial models require careful validation because changing market conditions can make historical patterns unreliable.
Healthcare Engineering
Healthcare systems can use predictive models to support resource planning, equipment monitoring, patient-risk assessment, and operational forecasting.
Because healthcare involves sensitive information and high consequences, model validation, privacy, fairness, and human oversight are especially important.
Cybersecurity
Anomaly detection can identify unusual network behavior.
A system might flag activity that differs significantly from normal patterns and allow security teams to investigate potential threats.
Common Mistakes
Using Poor-Quality Data
A sophisticated model cannot compensate for fundamentally unreliable input data.
Solution: Establish strong data-quality procedures before modeling.
Choosing the Most Complicated Algorithm
Advanced algorithms are not automatically better.
A complicated model can be difficult to explain, maintain, and validate.
Solution: Begin with a simple baseline and increase complexity only when justified.
Ignoring Data Leakage
Data leakage occurs when information that would not realistically be available at prediction time accidentally enters the training process.
This can make model performance appear excellent during testing while failing in real operation.
Solution: Carefully separate historical information available before prediction from information generated afterward.
Confusing Correlation With Causation
Two variables may appear related without one causing the other.
For example, increased machine temperature and equipment failure may occur together, but additional engineering investigation may be necessary to understand the physical mechanism.
Ignoring Model Drift
A model that worked well last year may perform poorly when operating conditions change.
Solution: Monitor predictions and periodically evaluate the model against new data.
Challenges & Solutions
| Challenge | Impact | Practical Solution |
|---|---|---|
| Missing data | Reduced reliability | Data validation and appropriate imputation |
| Imbalanced classes | Poor minority detection | Suitable sampling and evaluation methods |
| Model complexity | Difficult interpretation | Explainable models and feature analysis |
| Data drift | Performance degradation | Continuous monitoring |
| Privacy | Compliance and trust issues | Access controls and data governance |
| Biased data | Unfair predictions | Bias assessment and representative datasets |
| Insufficient domain knowledge | Misleading patterns | Collaboration with engineers and specialists |
Technical Challenge: Scalability
Large datasets may contain millions or billions of records.
Organizations may need distributed processing, cloud infrastructure, optimized databases, or specialized machine-learning platforms.
Organizational Challenge: Trust
Engineers and managers may hesitate to rely on predictions they cannot understand.
Explainability is therefore important.
A model should ideally provide useful evidence about why a prediction was generated, especially when the prediction affects safety, maintenance, finance, or other critical decisions.
Case Study
Predictive Maintenance in a Manufacturing Facility
Consider a hypothetical manufacturing facility operating hundreds of rotating machines.
The company previously relied on scheduled maintenance. While this approach prevented some failures, it also resulted in unnecessary maintenance and occasional unexpected breakdowns.
The engineering team installed sensors capable of recording vibration, temperature, operating speed, and load.
Historical maintenance records were combined with sensor measurements.
Data Mining Stage
Engineers discovered several recurring patterns.
Machines that eventually developed certain mechanical problems often showed changes in vibration behavior before failure. Temperature changes and operating conditions also provided additional context.
The team then created features representing machine condition and operating history.
Predictive Stage
A classification model was developed to identify machines showing elevated failure risk.
Instead of automatically shutting equipment down, the system generated maintenance alerts.
Engineers reviewed the alerts and performed physical inspections.
Result
The important improvement was not simply the predictive algorithm.
The real improvement came from connecting:
Sensors → Data → Pattern Discovery → Prediction → Engineering Inspection → Maintenance Action
This human-machine collaboration is often more practical than completely automated decision-making.
Essential Tips
Start With the Engineering Problem
Do not begin with an algorithm.
Begin with the operational problem you need to solve.
Build a Baseline
Always establish a simple reference model.
A complex system should demonstrate a meaningful improvement over a reasonable baseline.
Keep Data and Model Pipelines Reproducible
Document:
- Data sources
- Cleaning procedures
- Feature definitions
- Model versions
- Training dates
- Evaluation methods
- Deployment configuration
Reproducibility is essential for professional engineering environments.
Use Domain Knowledge
Machine-learning systems are powerful, but engineering knowledge remains essential.
A mechanical engineer understands physical behavior that may not be obvious from a dataset alone.
Monitor the System After Deployment
Track:
- Prediction quality
- Data quality
- Missing values
- Changes in feature distributions
- False alarms
- Missed events
- User feedback
Protect Data
Security and privacy should be integrated into the architecture from the beginning.
🔐 Good analytics requires good governance.
FAQs
What is the main purpose of data mining?
The main purpose of data mining is to discover useful patterns, relationships, trends, groups, and anomalies within datasets.
Is predictive analytics the same as machine learning?
No. Predictive analytics is a broader analytical approach. Machine learning is one group of techniques that can be used to build predictive systems.
What industries use predictive analytics?
Predictive analytics is used in manufacturing, transportation, finance, energy, retail, telecommunications, healthcare, cybersecurity, logistics, and many other sectors.
Does predictive analytics always produce accurate predictions?
No. Predictions contain uncertainty. Accuracy depends on data quality, model selection, historical relevance, operating conditions, and many other factors.
What programming languages are commonly used?
Python and R are widely used for data mining and predictive analytics. SQL is also essential for accessing and preparing data. Other languages can be important in production systems depending on the organization.
Can beginners learn data mining?
Yes. Beginners can start with basic statistics, Python or another analytical language, SQL, data visualization, and fundamental machine-learning concepts before progressing to advanced techniques.
Why is data preprocessing important?
Preprocessing removes or manages problems such as missing values, inconsistent records, duplicates, incorrect formats, and irrelevant information. Better input data generally leads to more reliable analysis.
What is the future of predictive analytics?
The field is moving toward more automated data pipelines, real-time analytics, edge computing, explainable AI, intelligent industrial systems, and increasingly integrated AI-assisted decision support.
Conclusion
Data mining and predictive analytics represent a fundamental shift from simply storing information to actively learning from it. 📊⚙️
Data mining helps organizations discover hidden patterns, while predictive analytics uses those patterns and other evidence to estimate future outcomes. Together, they can transform large and complex datasets into practical engineering intelligence.
The most successful systems are not necessarily those using the most advanced algorithms. They are systems built around clearly defined problems, reliable data, appropriate models, careful validation, domain expertise, and continuous monitoring.
For students, learning these technologies provides a valuable foundation for careers in data science, artificial intelligence, engineering analytics, and automation. For professionals, they offer opportunities to improve reliability, efficiency, safety, forecasting, and decision-making.
The core principle can be remembered simply:
Collect → Clean → Discover → Predict → Validate → Act → Improve. 🚀
When this cycle is implemented responsibly, data stops being merely a collection of numbers and becomes an engineering resource capable of supporting smarter decisions and more resilient systems.




