
Data Mining for Business Analytics: Concepts, Techniques and Applications in Python
Introduction
Modern businesses generate enormous amounts of information from websites, mobile applications, transactions, customer interactions, sensors, social platforms, and enterprise systems. The real challenge is not simply collecting this information—it is discovering useful patterns that can support better decisions. 🔎📊
This is where data mining for business analytics becomes valuable. Data mining combines statistics, machine learning, database technologies, and analytical reasoning to discover meaningful relationships hidden inside large datasets.
Python has become an important language for this work because its ecosystem supports data preparation, visualization, machine learning, automation, and business reporting. Libraries such as pandas, NumPy, Matplotlib, Seaborn, and scikit-learn allow analysts to move from raw business data toward actionable insights within a single environment. Python is also widely used for data visualization and dashboard development.


For students, data mining provides a practical bridge between programming and business intelligence. For professionals, it can support customer segmentation, fraud detection, demand forecasting, recommendation systems, operational optimization, and many other applications. 🚀


The goal of this article is to explain the major concepts, techniques, workflow, Python tools, applications, challenges, and practical considerations behind data mining for business analytics.
Background Theory
From Raw Data to Business Intelligence
Business data normally begins as raw observations. A retailer may collect product transactions, customer information, payment records, website visits, and inventory movements.
Raw information by itself does not automatically create business value.
A typical analytical progression is:
Raw Data → Information → Patterns → Insights → Decisions → Business Action
Data mining operates mainly in the middle of this process. It attempts to uncover patterns that may not be obvious through simple reporting.
Descriptive, Predictive, and Prescriptive Analytics
Business analytics is commonly divided into several analytical perspectives.
Descriptive analytics asks:
What happened?
Examples include monthly sales reports, customer counts, website traffic, and product performance.
Predictive analytics asks:
What is likely to happen?
Examples include customer churn prediction, demand forecasting, and credit-risk assessment.
Prescriptive analytics goes further:
What should we do?
For example, a business may use analytical results to determine which customers should receive a promotion or which products should receive additional inventory.
Data mining can contribute to all three levels.
The Role of Python
Python provides a flexible environment for the complete analytical lifecycle.
Common tools include:
| Python Tool | Business Analytics Role |
|---|---|
| pandas | Data manipulation and preparation |
| NumPy | Numerical computing |
| Matplotlib | Basic visualization |
| Seaborn | Statistical visualization |
| scikit-learn | Machine learning and data mining |
| Plotly | Interactive visualization |
| Jupyter | Exploration and experimentation |
| Streamlit | Rapid analytical applications |
| Dash | Interactive web dashboards |
Modern Python dashboard workflows can combine data processing with interactive charts and business KPIs.
Definition
What Is Data Mining?
Data mining is the systematic process of discovering useful patterns, relationships, trends, groups, anomalies, or predictive signals within datasets.
In business analytics, data mining transforms large collections of business observations into information that can help organizations understand customers, products, markets, risks, and operational processes.
It is important to understand that data mining is not simply “running a machine-learning algorithm.”
A successful project normally requires:
- A clearly defined business problem
- Relevant data
- Data cleaning
- Feature preparation
- Exploratory analysis
- Appropriate mining techniques
- Model evaluation
- Business interpretation
- Deployment or decision-making
💡 Data Mining vs Data Analysis
Data analysis can involve summarizing and investigating known information.
Data mining focuses more strongly on discovering previously unknown or useful patterns.
For example, an analyst might report that sales increased during December.
A data-mining project could discover that a particular customer segment tends to purchase specific product combinations during the weeks before Christmas.
That second discovery may lead to a new marketing strategy. 💡
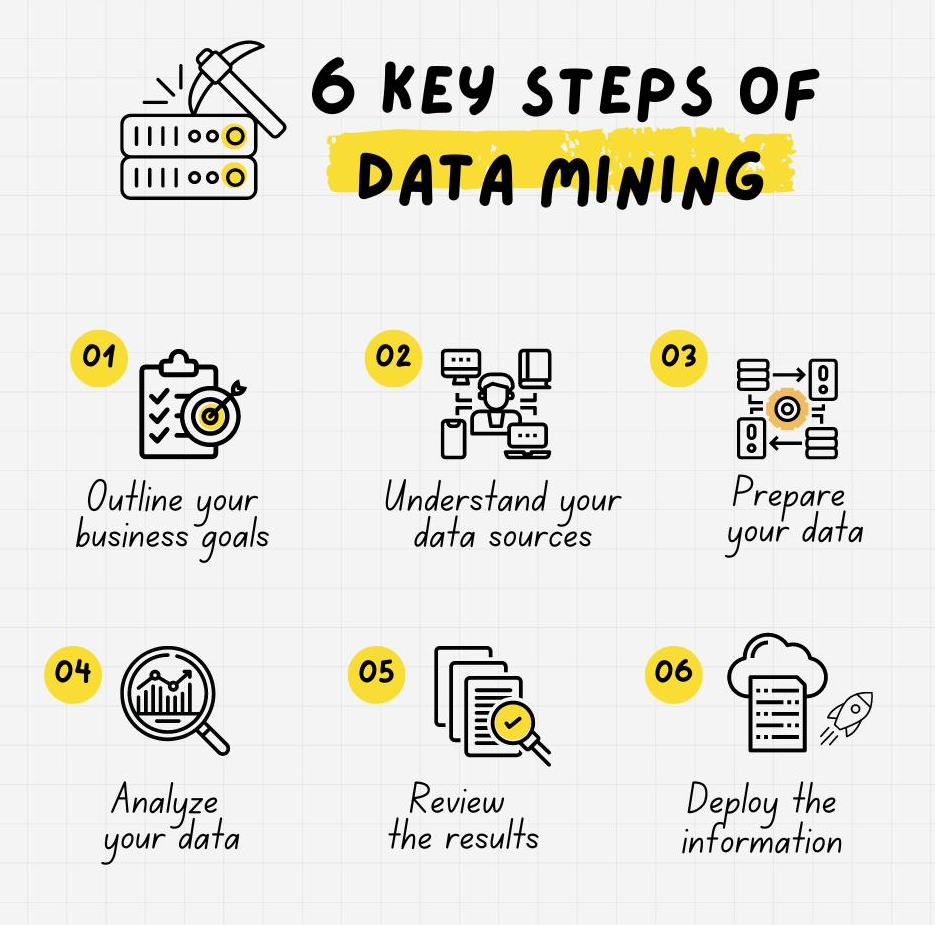
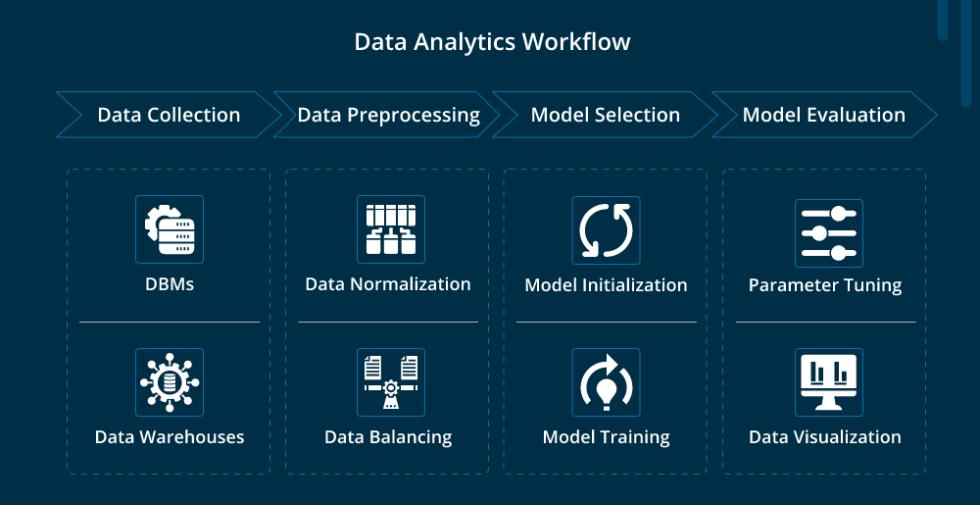
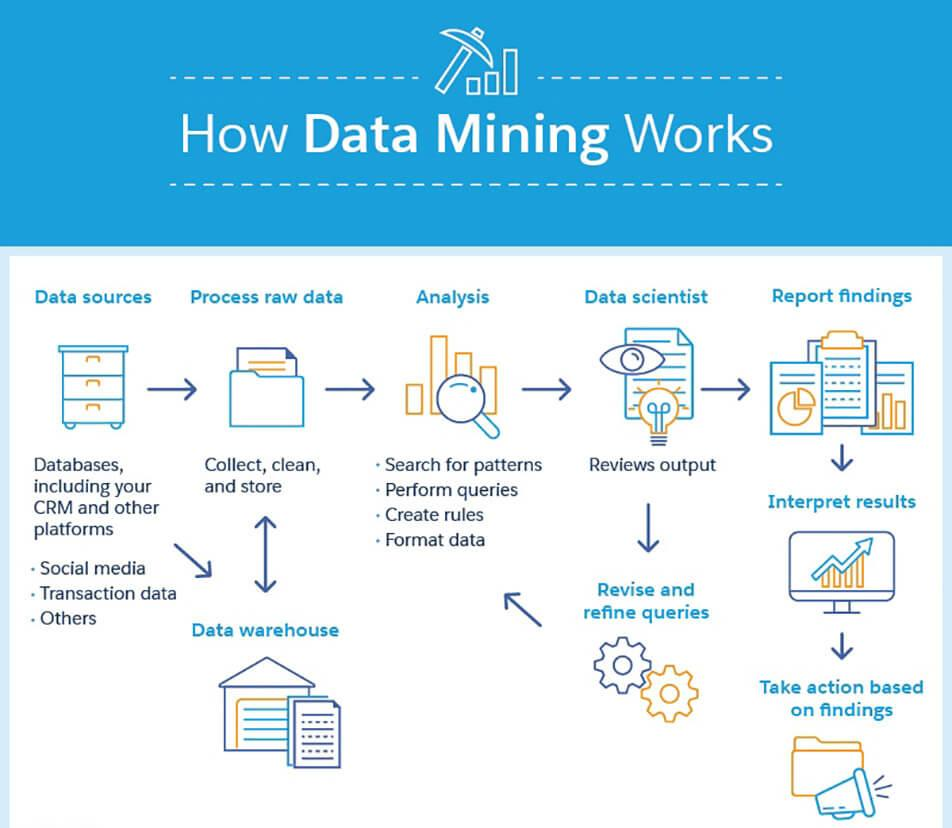
Step-by-Step Data Mining Workflow



Step 1: Define the Business Problem
Begin with the business question—not the algorithm.
Examples include:
- Why are customers leaving?
- Which products are commonly purchased together?
- Which transactions look suspicious?
- 💡 Which customers are most valuable?
- Which products are likely to experience higher demand?
- Which marketing channels perform best?
A poorly defined question can produce technically impressive but commercially useless results.
Step 2: Collect Relevant Data
Potential sources include:
- CRM systems
- E-commerce platforms
- ERP databases
- Point-of-sale systems
- Web analytics
- Mobile applications
- Customer-support systems
- IoT devices
- Surveys
- Financial systems
The quality and relevance of these sources strongly influence the final results.
Step 3: Clean the Data
Business datasets frequently contain:
- Missing values
- Duplicate records
- Incorrect categories
- Inconsistent dates
- Outliers
- Formatting errors
- Invalid transactions
Python’s pandas library can be used to inspect, transform, filter, merge, and organize these datasets.
Step 4: Explore the Dataset
Exploratory data analysis helps analysts understand the structure of the information.
Useful questions include:
- Which variables are available?
- Which categories dominate?
- 💡 Are there unusual observations?
- Are some variables strongly related?
- Are important values missing?
- Do customer behaviors differ between regions?
Visualization can make these patterns easier to recognize.
Step 5: Select a Data-Mining Technique
The technique depends on the business problem.
For example:
Customer groups → Clustering
Fraudulent behavior → Anomaly detection
Customer churn → Classification
Future demand → Forecasting or regression
Product relationships → Association-rule mining
Step 6: Train and Evaluate
For supervised learning, historical examples can be divided into training and testing data.
Evaluation should consider more than model accuracy.
A business may care about:
- Precision
- Recall
- F1-score
- Interpretability
- Operational cost
- False positives
- False negatives
- Business impact
Step 7: Convert Results into Decisions
A model is not the final destination.
The real objective is to produce an insight that somebody can act upon.
For example:
Model → Customer segment → Marketing campaign → Customer response → Business measurement
This creates a complete analytical feedback loop.
Major Data Mining Techniques
Classification
Classification assigns observations to predefined categories.
Business examples include:
- Likely to churn / unlikely to churn
- Fraud / legitimate
- Approved / rejected
- High-value / low-value customer
Popular Python approaches include decision trees, random forests, logistic regression, and support-vector methods.
Clustering
Clustering groups similar observations without requiring predefined labels.
A retailer might discover several customer groups:
- Frequent premium customers
- Occasional discount shoppers
- New customers
- Inactive customers
This can support personalized marketing and customer relationship management.
Association Rule Mining
Association mining searches for items or events that frequently occur together.
For example, an online retailer may discover that customers purchasing a particular electronic device frequently purchase an accessory during the same shopping session.
This can support:
- Product recommendations
- Cross-selling
- Store layout
- Bundle creation
- Promotional campaigns
Anomaly Detection
Anomaly detection identifies observations that differ significantly from normal behavior.
Applications include:
- Fraud detection
- Network security
- Manufacturing quality control
- Unusual financial transactions
- Abnormal website activity
An anomaly is not automatically an error or fraud. It is a signal that deserves investigation.
Regression and Prediction
Regression-based methods can identify relationships between variables and support predictions.
Business applications include:
- Sales estimation
- Revenue planning
- Demand analysis
- Customer-value estimation
- Cost prediction
Comparison of Data Mining Techniques
| Technique | Main Purpose | Example Business Application | Typical Python Approach |
|---|---|---|---|
| Classification | Predict categories | Churn detection | scikit-learn |
| Clustering | Discover groups | Customer segmentation | K-Means |
| Association Mining | Find relationships | Product recommendations | Association-rule libraries |
| Anomaly Detection | Find unusual records | Fraud screening | Isolation Forest |
| Regression | Predict continuous outcomes | Sales prediction | Regression models |
| Forecasting | Analyze future trends | Demand planning | Time-series methods |
The best technique is not necessarily the most sophisticated one. A simple, interpretable model can sometimes create more business value than a complex model that stakeholders cannot understand.
Diagrams and Tables


A Practical Data-Mining Architecture
A typical business architecture can be represented as:
Business Systems
⬇
Data Collection
⬇
Data Warehouse / Data Lake
⬇
Python Data Preparation
⬇
Exploratory Analysis
⬇
Data Mining / Machine Learning
⬇
Evaluation
⬇
Dashboard / Report / Application
⬇
Business Decision
This architecture demonstrates an important principle: data mining should connect directly to business processes.
Python Technology Stack
| Layer | Example Technologies |
|---|---|
| Data source | SQL, APIs, CSV, cloud platforms |
| Processing | pandas, NumPy |
| Visualization | Matplotlib, Seaborn, Plotly |
| Mining | scikit-learn and specialized libraries |
| Experimentation | Jupyter Notebook |
| Application | Streamlit or Dash |
| Deployment | Cloud or enterprise infrastructure |
Interactive Python dashboards can combine filters, metrics, charts, and business indicators into a single analytical interface.
Examples Without Equations or Mathematics
Example 1: Retail Customer Segmentation
Imagine a supermarket with thousands of customers.
The business has transaction information showing purchasing frequency, product categories, average order characteristics, and shopping channels.
A clustering technique can identify groups with similar behavior.
Marketing teams could then create different campaigns for different customer groups rather than sending identical promotions to everyone.
Example 2: Online Store Recommendations
An e-commerce business can examine historical purchasing behavior to discover product relationships.
If customers repeatedly purchase two products together, the website can display one product as a recommendation when the customer views the other.
Example 3: Banking Fraud Detection
A financial institution can monitor transactions for unusual patterns.
An analytical system may identify a transaction that differs strongly from the customer’s normal behavior based on location, timing, frequency, or transaction characteristics.
The system can flag the event for additional review.
Example 4: Customer Churn
A subscription company may want to identify customers who are becoming less engaged.
Data mining can analyze behavioral patterns such as declining activity, reduced purchases, or changes in service usage.
The company can then prioritize retention campaigns.
Real-World Applications
Retail and E-Commerce
Data mining helps retailers understand:
- Customer preferences
- Product demand
- Purchase combinations
- Customer lifetime value
- Promotional performance
- Inventory patterns
Finance
Financial organizations use analytical techniques for:
- Fraud detection
- Credit assessment
- Customer segmentation
- Risk analysis
- Transaction monitoring
Manufacturing
Manufacturers can apply data mining to:
- Predictive maintenance
- Quality control
- Production optimization
- Equipment monitoring
- Defect identification
Healthcare
Organizations can use analytical methods for:
- Operational planning
- Patient-flow analysis
- Resource allocation
- Risk modeling
- Service-demand forecasting
Marketing
Marketing teams can discover:
- Audience segments
- Campaign patterns
- Customer preferences
- Conversion behavior
- Channel performance
Common Mistakes
Focusing on Algorithms Before the Problem
Choosing an advanced algorithm before understanding the business problem can waste time.
Better approach: define the decision that the analysis must support.
Ignoring Data Quality
Poor data produces unreliable conclusions.
Cleaning should be considered a fundamental analytical stage rather than an optional task.
Using Too Many Variables
More data does not automatically mean better modeling.
Irrelevant or redundant features can increase complexity and sometimes reduce model quality.
Confusing Correlation with Causation
A discovered relationship does not automatically prove that one variable causes another.
Business decisions should consider context, experimentation, and domain knowledge.
Evaluating Only Accuracy
A model with high accuracy may still perform poorly for an important minority class.
For fraud detection, for example, missing rare fraudulent events may be more serious than correctly identifying ordinary transactions.
Challenges and Solutions
| Challenge | Possible Solution |
|---|---|
| Missing data | Apply appropriate imputation or exclusion strategies |
| Duplicate records | Establish reliable deduplication rules |
| Unbalanced classes | Use suitable evaluation and sampling techniques |
| Data silos | Integrate data sources systematically |
| Model complexity | Prefer interpretable approaches when appropriate |
| Privacy concerns | Apply governance, minimization, and access controls |
| Changing customer behavior | Monitor model performance continuously |
| Difficult business interpretation | Translate technical findings into business KPIs |
Privacy and Responsible Analytics
Business analytics can involve sensitive customer or employee information.
Organizations should establish appropriate controls around:
- Data access
- Data retention
- Privacy
- Security
- Consent
- Responsible model usage
- Regulatory requirements
A technically successful mining system is not truly successful if it creates unacceptable privacy or governance risks.
Case Study: E-Commerce Customer Analytics
Consider a fictional European e-commerce company called NorthStar Market.
The company sells electronics, household products, and accessories across several countries.
Management notices that overall customer numbers are growing, but repeat purchases are inconsistent.
The Business Problem
The company wants to understand:
Which customer groups are most likely to purchase again, and how can marketing resources be allocated more effectively?
Data Preparation
The analytical team collects historical order information and creates customer-level features describing purchase behavior.
They remove duplicate transactions, standardize dates, handle incomplete records, and investigate unusual values.
Data Mining
The team applies clustering to identify customer groups.
The resulting segments might include:
- High-frequency customers
- High-value occasional customers
- New customers
- Discount-sensitive customers
- Inactive customers
Business Interpretation
The results reveal that the largest customer segment is not necessarily the most profitable.
A smaller group of highly engaged customers generates substantial commercial value.
The marketing department therefore develops different strategies for each segment.
Deployment
The analytical results are presented through an interactive dashboard.
Managers can filter the information by:
- Country
- Product category
- Customer segment
- Sales channel
- Time period
Python-based dashboard frameworks can support this type of interactive business reporting.
Result
The major benefit is not simply the clustering model.
The real value comes from connecting:
Customer Data → Segmentation → Marketing Strategy → Measurable Business Action
This is the central philosophy of business-oriented data mining.
Essential Tips for Students and Professionals
Start With Small Projects
A small sales or customer dataset is often better for learning than a massive enterprise dataset.
Focus first on understanding the complete workflow.
Learn pandas Thoroughly
Strong data manipulation skills are essential.
Learn how to:
- Load data
- Filter rows
- Select columns
- Handle missing values
- Group records
- Merge datasets
- Create new features
- Work with dates
Visualize Before Modeling
Visualization can reveal unexpected patterns before a model is created.
Use charts to understand distributions, trends, categories, and unusual observations.
Connect Technical Results to KPIs
Instead of saying:
“The model identified five clusters.”
Explain:
“The analysis identified five customer groups that require different retention strategies.”
The second statement communicates business value.
Validate With Domain Experts
Data scientists understand algorithms, while business professionals often understand the operational environment better.
Combining both perspectives can produce stronger analytical decisions.
Build Reproducible Workflows
Keep data preparation, feature creation, modeling, evaluation, and documentation organized.
Reproducibility becomes increasingly important as projects move from academic experiments into production environments.
FAQs
What is data mining in business analytics?
Data mining is the process of discovering useful patterns, relationships, groups, anomalies, and predictive signals from business data. It helps organizations transform large datasets into insights that support decisions.
Is Python good for data mining?
Yes. Python provides a broad ecosystem for data preparation, visualization, machine learning, statistical analysis, and application development. Libraries such as pandas and scikit-learn make it particularly practical for analytical workflows.
Is data mining the same as machine learning?
Not exactly. Machine learning is an important component of modern data mining, but data mining is broader. It can include data preparation, pattern discovery, statistical techniques, visualization, clustering, association analysis, anomaly detection, and predictive modeling.
Which Python library is best for data mining?
There is no single best library for every task. pandas is excellent for data preparation, while scikit-learn provides many machine-learning algorithms. Visualization libraries such as Matplotlib, Seaborn, and Plotly complement the mining process.
Can beginners learn business data mining?
Absolutely. Beginners should start with Python fundamentals, pandas, data visualization, basic statistics, and simple machine-learning concepts. Practical projects are one of the best ways to develop these skills.
What industries use data mining?
Data mining is used across retail, e-commerce, finance, manufacturing, telecommunications, marketing, logistics, healthcare, technology, and many other industries.
Why is data cleaning important?
Mining algorithms learn from the information supplied to them. If the underlying dataset contains serious errors, duplicates, missing information, or inconsistent formats, the resulting insights can become unreliable.
What is the biggest advantage of data mining?
Its major advantage is the ability to discover patterns that may be difficult to identify through traditional reporting alone. When those patterns are connected to business decisions, they can improve efficiency, customer understanding, risk management, and strategic planning.
Conclusion
Data mining for business analytics is fundamentally about turning data into actionable knowledge. 📊🐍
The process begins with a business question and continues through data collection, cleaning, exploration, feature preparation, pattern discovery, modeling, evaluation, and interpretation.
Python makes this workflow accessible because analysts can work with data, visualization, machine learning, and analytical applications within a connected ecosystem. Tools such as pandas, NumPy, scikit-learn, Matplotlib, Seaborn, Plotly, Streamlit, and Dash can support different stages of the journey.
For students, the most effective learning strategy is to combine programming knowledge with real business problems. For professionals, the priority should be creating reliable, interpretable, and measurable analytical solutions.
Ultimately, the strongest data-mining project is not the one with the most complicated algorithm.
It is the one that answers an important question, produces trustworthy insight, and helps an organization make a better decision. 🚀📈




