Before Machine Learning: Probability and Statistics for AI — The Mathematical Foundation of Data Science
Introduction: Why Probability and Statistics Come Before Machine Learning 🤖📊
Machine learning can look like a world of algorithms, neural networks, Python code, and powerful computing. However, underneath many successful AI systems is something much more fundamental: probability and statistics.
Artificial intelligence rarely operates with perfect information. A medical image may contain noise. A sensor may produce incomplete readings. A customer may behave differently from historical patterns. A machine-learning model may be highly confident about one prediction and uncertain about another.
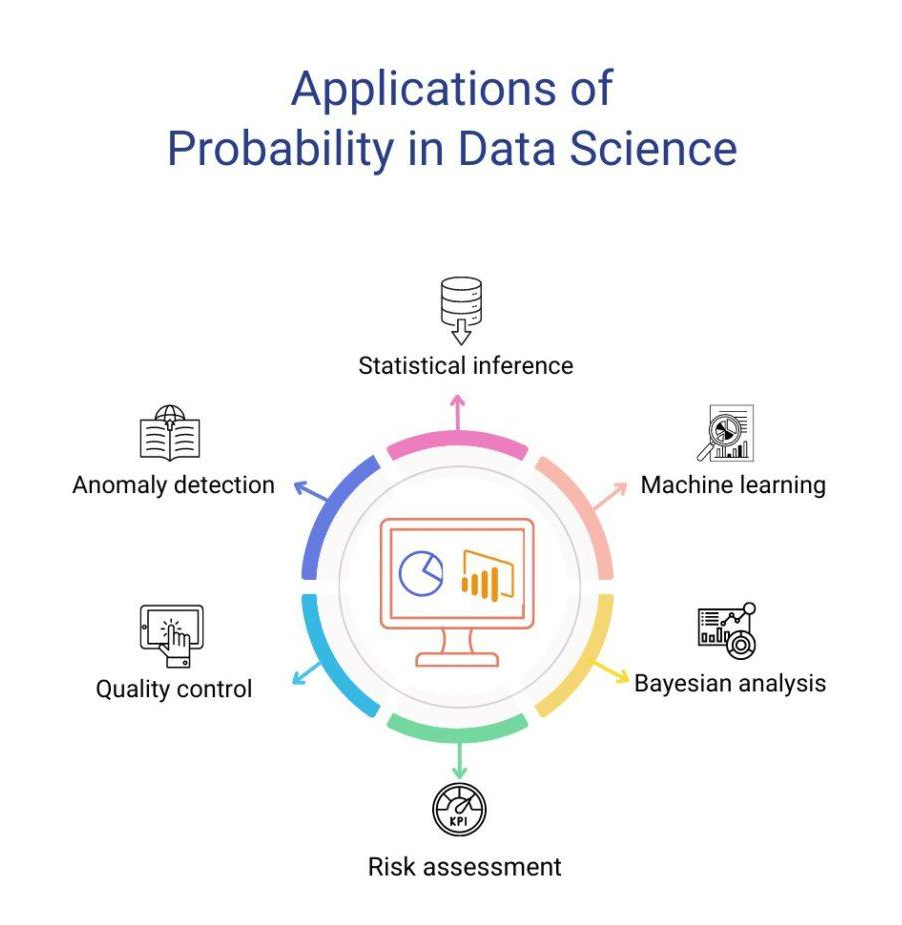
Probability provides a language for describing that uncertainty, while statistics provides methods for learning from observed data. Together, they form an important mathematical foundation for modern data science and statistical machine learning.


Think of the relationship like this:
Data → Statistics → Probability Model → Machine Learning → Prediction → Decision
A beginner can start with intuitive concepts such as averages, distributions, probability, and sampling. A professional can continue toward more advanced ideas such as Bayesian inference, likelihood, hypothesis testing, entropy, and probabilistic modeling.


This makes probability and statistics more than theoretical mathematics. They are practical tools for understanding what data is saying—and, equally importantly, what data cannot tell us.
Background Theory 📚
Before training a machine-learning model, engineers and data scientists need to understand the behavior of the data.
A dataset is not simply a collection of numbers. It represents observations generated by some underlying process.
For example, an engineering dataset might contain:
- Temperature measurements 🌡️
- Vibration readings
- Material properties
- Machine operating conditions
- Failure events
- Sensor measurements
- Production times
These observations naturally vary.
Statistics helps summarize this variation. Probability helps construct a framework for reasoning about it.
Modern machine-learning education commonly connects probability and statistics directly to model building, estimation, inference, and prediction.
Population and Sample
A population represents the complete group we want to understand.
A sample is a smaller collection taken from that population.
For example, suppose an engineer wants to study the reliability of a particular industrial component.
Testing every component manufactured over several years may be impossible.
Instead, the engineer could analyze a representative sample.
The statistical challenge is then:
How confidently can we use the sample to understand the larger population?
This question appears repeatedly in machine learning.
Randomness and Uncertainty
Real-world systems contain randomness.
Even if two machines receive nearly identical operating conditions, their outputs may differ slightly.
Probability allows us to describe this uncertainty systematically.
Instead of saying:
“This machine will definitely fail.”
a probabilistic system might communicate:
“The available evidence indicates a high likelihood of failure.”
That distinction is extremely important in AI-assisted decision-making.
Definition: Probability and Statistics 🔎
What Is Probability?
Probability measures how likely an event is to occur.
Its values range from:
0 → impossible
to
1 → certain
For example, an AI system detecting whether an image contains a particular object may produce a probability-like confidence value.
Probability therefore helps answer:
How likely is something?
What Is Statistics?
Statistics is the discipline of collecting, organizing, analyzing, interpreting, and communicating information obtained from data.
Statistics can help answer questions such as:
- What is typical?
- How much does the data vary?
- Are two groups different?
- Is a relationship meaningful?
- How reliable is an estimate?
- Could an observed pattern have occurred by chance?
Probability vs. Statistics
A useful distinction is:
| Concept | Main Question | AI Connection |
|---|---|---|
| Probability | What could happen? | Prediction and uncertainty |
| Statistics | What happened in the data? | Data analysis |
| Inference | What can we conclude? | Model interpretation |
| Distribution | How are values arranged? | Modeling data |
| Estimation | What parameters best describe data? | Model training |
| Hypothesis testing | Is an observed effect meaningful? | Experimental analysis |
Step-by-Step: From Raw Data to an AI Model 🚀
Understanding the workflow is often easier than memorizing isolated definitions.
Step 1: Collect Observations
Imagine an engineering company wants to predict equipment failures.
The dataset could contain:
- Operating temperature
- Pressure
- Vibration level
- Operating hours
- Maintenance history
- Failure status
The first objective is not to train a neural network.
The first objective is to understand the data.
Step 2: Explore the Dataset
The engineer examines:
- Minimum and maximum values
- Average values
- Variation
- Missing observations
- Outliers
- Relationships between variables
Visualization can reveal patterns that raw tables hide.
Step 3: Study Distributions
The next question is:
How are the observations distributed?
Some measurements may be concentrated around a central region.
Others may be strongly skewed.
Some events may occur rarely but have major consequences.
Understanding distributions helps engineers select appropriate statistical methods and machine-learning approaches.
Step 4: Identify Relationships
Suppose equipment failures become more common as vibration increases.
That does not automatically prove that vibration causes failure.
The statistical relationship must be investigated carefully.
This is where concepts such as correlation, regression, experimental design, and causal reasoning become valuable.
Step 5: Build a Probabilistic View
Instead of treating a prediction as simply “failure” or “no failure,” an AI system can represent uncertainty.
For example:
Low risk → Moderate risk → High risk
This can be much more useful for operational decision-making.
Step 6: Train the Machine-Learning Model
Only after understanding the data should the engineer begin model development.
The workflow can become:
Dataset → Exploration → Statistical Analysis → Feature Engineering → Model Training → Validation → Prediction
Step 7: Evaluate Uncertainty
A model that achieves good predictive performance on one dataset may perform differently on another.
Therefore, professionals should investigate:
- Generalization
- Sampling variation
- Data quality
- Confidence
- Bias
- Model uncertainty


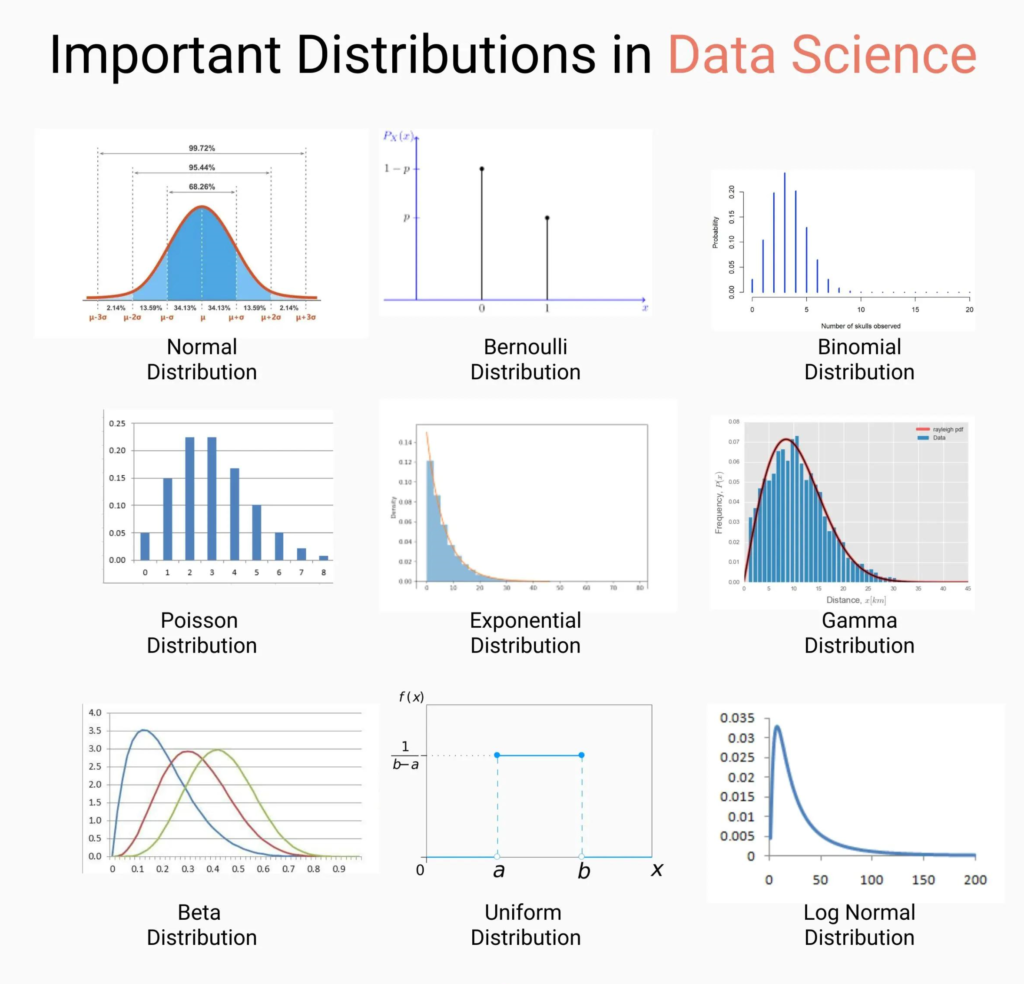
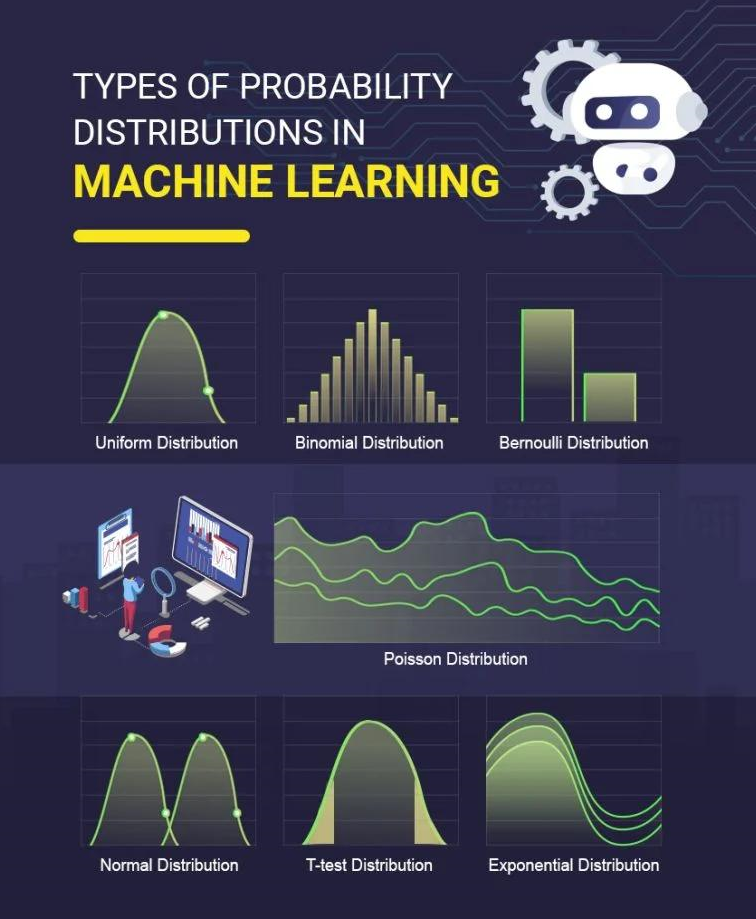
Probability Distributions: The Shape Behind Data 📈
A probability distribution describes how possible values or events are organized.
Discrete Distributions
Discrete distributions describe outcomes that can be counted.
Examples include:
- Number of failures
- Number of defective products
- Number of successful transactions
- Number of arrivals
Important examples include the Bernoulli, Binomial, and Poisson distributions.
Continuous Distributions
Continuous distributions describe measurements that can take many possible values.
Examples include:
- Temperature
- Pressure
- Length
- Time
- Voltage
- Weight
The normal distribution is particularly important in statistics because many naturally occurring measurements can sometimes be modeled approximately using its characteristic bell-shaped form.
Why Distributions Matter in AI
A machine-learning engineer needs to understand whether the assumptions behind a statistical method are reasonable.
For example, treating highly skewed data as if it were symmetric can produce misleading interpretations.
Distribution awareness therefore becomes a practical engineering skill.
Comparison: Traditional Statistics vs. Machine Learning ⚙️
| Feature | Statistical Analysis | Machine Learning |
|---|---|---|
| Primary goal | Understand data | Make predictions or decisions |
| Typical emphasis | Interpretation | Prediction |
| Data requirement | Can work with smaller samples | Often benefits from larger datasets |
| Uncertainty | Usually explicitly analyzed | Can be explicit or implicit |
| Model complexity | Often interpretable | Can range from simple to extremely complex |
| Example | Testing whether groups differ | Predicting equipment failure |
| Main risk | Incorrect inference | Poor generalization |
These approaches are not competitors.
In professional data science, they often work together.
A machine-learning practitioner who understands statistics can better evaluate whether a model’s apparent performance reflects a genuine pattern or simply an artifact of the dataset.
Diagrams and Key Statistical Concepts 🧠📊


The Statistical Learning Pipeline
             REAL-WORLD SYSTEM
                    ↓
              DATA COLLECTION
                    ↓
             DATA EXPLORATION
                    ↓
          ┌─────────┴─────────┐
          ↓                   ↓
     STATISTICS           PROBABILITY
          ↓                   ↓
          └─────────┬─────────┘
                    ↓
             MODEL BUILDING
                    ↓
              VALIDATION
                    ↓
               PREDICTION
                    ↓
               DECISION
Descriptive vs. Inferential Statistics
| Category | Purpose | Example |
|---|---|---|
| Descriptive statistics | Summarize observed data | Average machine temperature |
| Inferential statistics | Generalize beyond observed data | Estimate population behavior |
| Exploratory analysis | Discover patterns | Detect unusual clusters |
| Predictive modeling | Forecast outcomes | Predict future failure |
| Experimental analysis | Evaluate interventions | Compare maintenance strategies |
Examples 💡
Example 1: Predictive Maintenance
An industrial facility records vibration readings from motors.
Historical data shows that unusual vibration patterns frequently appear before failures.
Statistics helps engineers understand the distribution of vibration measurements.
Machine learning can then learn patterns associated with previous failures.
The result could be an early-warning system.
Example 2: Fraud Detection
A financial platform analyzes transaction behavior.
Most transactions may be routine, while fraudulent transactions represent a small minority.
Probability and statistics help characterize normal behavior and unusual observations.
A machine-learning model can then assign risk scores to new transactions.
Example 3: Medical Image Classification
An AI system analyzes medical images.
The system does not possess absolute certainty.
Instead, it evaluates patterns learned from historical examples and produces predictions with associated confidence.
This makes statistical reasoning especially important when AI outputs support high-stakes professional decisions.
Real-World Applications 🌍
Probability and statistics appear across nearly every engineering and AI discipline.
Engineering
Applications include:
- Reliability engineering
- Quality control
- Failure prediction
- Structural monitoring
- Signal processing
- Manufacturing optimization
Data Science
Data scientists use statistical methods for:
- Exploratory data analysis
- Sampling
- Feature analysis
- Experimentation
- Forecasting
- Model evaluation
Artificial Intelligence
Probabilistic reasoning contributes to:
- Classification
- Recommendation systems
- Computer vision
- Natural-language processing
- Robotics
- Autonomous systems
- Decision support
Robotics 🤖
A robot rarely knows its exact position with perfect certainty.
Sensor measurements contain noise.
Probability provides a framework for representing possible locations and updating beliefs as new sensor information arrives.
This principle is central to many forms of probabilistic robotics.
Common Mistakes ⚠️
Confusing Correlation With Causation
Two variables can move together without one causing the other.
A statistical relationship should therefore not automatically be interpreted as a causal relationship.
Ignoring Data Quality
A sophisticated algorithm cannot automatically repair fundamentally unreliable data.
Missing values, measurement errors, duplicated records, and biased samples can affect model results.
Focusing Only on the Average
The average can hide important information.
Two datasets can have similar averages while having dramatically different distributions.
Assuming More Data Always Means Better Data
Large datasets can still contain:
- Sampling bias
- Incorrect labels
- Duplicate records
- Measurement errors
- Unrepresentative observations
Quality and relevance matter.
Treating Model Confidence as Absolute Truth
A confidence score does not necessarily mean that an AI system is correct.
Professionals must understand how predictions were generated and whether the model was appropriately validated.
Challenges and Solutions 🛠️
| Challenge | Why It Matters | Practical Solution |
|---|---|---|
| Missing data | Can distort analysis | Investigate the reason for missingness |
| Outliers | May influence statistical summaries | Examine and validate unusual observations |
| Sampling bias | Produces misleading conclusions | Use representative sampling |
| Imbalanced classes | Rare events may be ignored | Use appropriate evaluation strategies |
| Data leakage | Produces unrealistically strong results | Separate training information from future information |
| Overfitting | Model memorizes training patterns | Use validation and regularization |
| Distribution shift | Real-world data changes | Monitor model performance continuously |
Case Study: Predicting Industrial Equipment Failure 🏭
Consider a fictional manufacturing facility operating hundreds of electric motors.
The engineering team wants to predict failures before they interrupt production.
Stage 1: Data Collection
Sensors record:
- Temperature
- Vibration
- Current
- Operating duration
- Load
- Maintenance events
The team also records whether a motor eventually failed.
Stage 2: Statistical Investigation
The engineers discover that most motors operate within a relatively stable temperature range.
However, some motors produce unusually high vibration readings.
The team investigates these observations rather than immediately deleting them.
Stage 3: Probability-Based Reasoning
Historical observations suggest that certain combinations of temperature, vibration, and operating conditions are associated with increased failure risk.
Instead of creating a simple rule such as:
“High vibration always means failure.”
the team develops a probabilistic risk model.
Stage 4: Machine-Learning Model
A classification model is trained using historical observations.
The model receives current sensor information and produces a risk prediction.
Stage 5: Operational Decision
The maintenance department can prioritize inspections based on risk.
The AI system therefore does not replace engineering judgment.
Instead, it helps engineers decide where attention is most valuable.
Stage 6: Continuous Monitoring
After deployment, the team continues monitoring performance.
This is important because machine behavior, environmental conditions, maintenance practices, and sensor characteristics can change over time.
Essential Tips for Students and Professionals 🎯
Build Intuition Before Memorizing Formulas
Understand what a statistical concept means before worrying about notation.
Ask:
What problem does this concept solve?
Learn to Read Distributions
Histograms, density plots, box plots, scatter plots, and probability distributions should become familiar visual tools.
Connect Every Concept to Data
When learning variance, think about variation in sensor measurements.
When learning sampling, think about selecting components from a production line.
When learning probability, think about uncertainty in AI predictions.
Practice With Python
Useful Python tools include:
- NumPy
- pandas
- SciPy
- Matplotlib
- scikit-learn
The goal is not simply to call functions.
The goal is to understand what those functions are calculating and why.
Learn Statistics Before Chasing Complex AI Models
A strong understanding of statistics can be more valuable than immediately jumping into increasingly complex neural-network architectures.
Develop Critical Thinking
Always ask:
Where did the data come from?
Is the sample representative?
What assumptions are being made?
Could another explanation exist?
How uncertain is the conclusion?
These questions separate responsible data analysis from blindly trusting model outputs.
FAQs ❓
Is probability really necessary for machine learning?
Yes. Probability provides a framework for reasoning about uncertainty, random variables, distributions, predictions, and many statistical learning methods.
Do I need advanced mathematics before learning AI?
No. Beginners can start with fundamental concepts such as averages, distributions, probability, sampling, and basic statistical reasoning. More advanced mathematics can be added progressively.
What is the difference between probability and statistics?
Probability generally starts with assumptions about possible outcomes and reasons about uncertainty. Statistics generally starts with observed data and attempts to understand or infer properties of the process that generated it.
Which probability distributions should an AI student learn first?
A useful starting group includes Bernoulli, Binomial, Normal, Poisson, and related continuous distributions. As your knowledge grows, you can explore distributions used in Bayesian modeling and more advanced statistical methods.
Is statistics more important than machine learning algorithms?
They serve different purposes. Algorithms provide mechanisms for learning patterns, while statistics helps you understand data, uncertainty, assumptions, sampling, and evidence. Strong AI practitioners benefit from both.
Can I learn probability and statistics using Python?
Absolutely. Python provides an excellent practical environment for experimenting with datasets, distributions, simulations, statistical analysis, visualization, and machine-learning models.
Why is probability important for AI?
AI systems often operate under incomplete or noisy information. Probability provides a mathematical language for representing uncertainty and reasoning about possible outcomes.
Should engineering students study statistics before machine learning?
Yes. For engineering students, statistics can provide useful preparation for understanding experimental data, measurement uncertainty, reliability, prediction, and machine-learning evaluation.
Conclusion: The Mathematics Behind Intelligent Decisions 🚀
Probability and statistics are not merely preliminary mathematics that students must complete before reaching “the interesting part” of AI.
They are part of the interesting part.
Machine learning works with imperfect observations, uncertain outcomes, changing environments, and complex relationships. Probability provides a framework for uncertainty, while statistics provides tools for extracting information from data.
The progression can be viewed as:
Observation → Data → Statistics → Probability → Modeling → Machine Learning → Prediction → Decision
For beginners, the journey should start with intuitive ideas: samples, populations, averages, variation, distributions, probability, and visualization.
For advanced learners, the path can continue toward inference, likelihood, Bayesian reasoning, hypothesis testing, probabilistic graphical models, uncertainty estimation, and statistical learning.
The most valuable mindset is simple:
Don’t just ask what an AI model predicts. Ask what the data supports, how uncertain the prediction is, and why the model should be trusted.
That mindset transforms probability and statistics from abstract mathematics into practical engineering tools—and creates a much stronger foundation for Data Science, Machine Learning, and Artificial Intelligence.