Learning Scientific Programming with Python 2nd Edition: A Practical Guide for Engineers and Scientists 🚀🐍
Introduction 🌍🔬
Scientific programming transforms scientific ideas, experimental measurements, engineering models, and large datasets into practical computational workflows. Instead of performing every calculation manually, engineers and researchers can use software to process thousands or millions of observations, simulate systems, visualize trends, and test different scenarios.
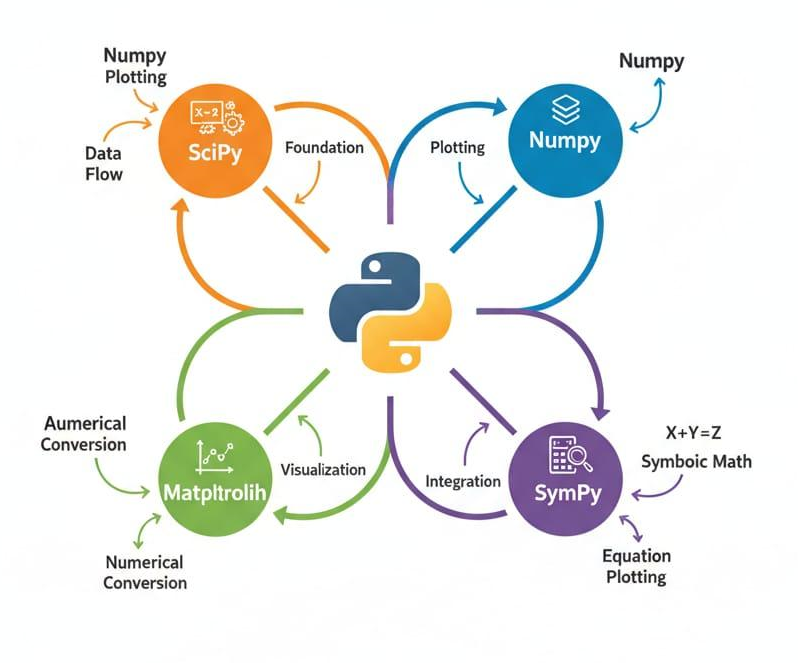
Python has become one of the most useful languages for this purpose because it combines relatively readable syntax with a large scientific ecosystem. Tools such as NumPy, SciPy, Pandas, Matplotlib, SymPy, and Jupyter allow beginners to start with simple calculations while giving professionals access to sophisticated numerical and analytical workflows.


For engineering students, scientific programming can connect classroom theory with real computational problems. For professionals, it can reduce repetitive work, improve data analysis, automate calculations, and support simulation-based decision making.
The goal is not simply to learn Python syntax. The real objective is to learn how to think computationally about scientific problems. 🧠⚙️

Background Theory 📚
Scientific programming sits at the intersection of several disciplines:
- 🐍 Programming
- 📐 Mathematics
- 🔬 Science
- ⚙️ Engineering
- 📊 Statistics
- 💻 Numerical computing
- 📈 Data visualization
Traditional scientific work often begins with an observation or physical problem. Measurements are collected, processed, analyzed, and interpreted. Scientific programming adds a computational layer between these stages.
A simplified workflow is:
Physical problem → Data → Computational model → Analysis → Visualization → Engineering decision
Python is particularly useful because these stages can be handled within one ecosystem.
The scientific Python ecosystem is built around numerical arrays, scientific algorithms, visualization, interactive computing, and specialized packages. NumPy provides an important numerical foundation, while SciPy adds higher-level scientific routines.
Jupyter notebooks are also valuable because they combine executable code, explanatory text, and results in one interactive environment.
Definition 🧩
Scientific programming with Python is the use of Python and specialized scientific libraries to perform numerical calculations, analyze scientific data, develop computational models, automate experiments, visualize results, and solve engineering or research problems.
It is different from ordinary programming because the primary objective is usually not to build a website or business application.
Instead, scientific programming focuses on questions such as:
- How does a physical system behave?
- What does an experimental dataset tell us?
- Can a mathematical model reproduce observed behavior?
- How can thousands of measurements be processed automatically?
- Which parameters have the greatest influence on a system?
- How can simulation results be visualized clearly?
This makes scientific Python useful across mechanical engineering, civil engineering, electrical engineering, environmental science, physics, chemistry, biomedical research, aerospace, energy systems, and data science.
The Core Scientific Python Toolkit 🛠️
Python
Python provides the programming foundation.
Students should first become comfortable with variables, data types, conditions, loops, functions, modules, file handling, and error handling.
A strong understanding of these fundamentals makes scientific libraries much easier to learn.
NumPy
NumPy is central to numerical computing in Python. Its array-oriented approach makes it possible to efficiently manipulate multidimensional numerical data and perform mathematical operations across entire arrays.
For example, instead of treating thousands of measurements as individual variables, an engineer can organize them into structured numerical arrays.
SciPy
SciPy provides higher-level scientific and numerical algorithms, including tools for optimization, integration, statistics, interpolation, signal processing, and other computational tasks.
Pandas
Pandas is especially useful when scientific information is organized into tables.
It can help engineers work with:
- CSV files
- Experimental measurements
- Sensor records
- Time-series data
- Laboratory results
- Spreadsheet-based datasets
Matplotlib
Matplotlib converts numerical results into graphs and figures. Visualization is critical because patterns that are difficult to recognize in a large dataset can become immediately obvious in a well-designed plot.
SymPy
SymPy is useful when a problem requires symbolic mathematics rather than only numerical calculations.
Jupyter
Jupyter provides an interactive environment where code, explanations, figures, and results can be combined into a computational document.
Step-by-Step: How to Learn Scientific Programming with Python 🚀


Step 1: Learn Python Fundamentals
Do not begin with advanced scientific libraries immediately.
First understand:
- Variables
- Lists and dictionaries
- Conditions
- Loops
- Functions
- Modules
- Exceptions
- File input and output
You do not need to become a Python expert before moving forward, but you should be able to write small programs independently.
Step 2: Learn Numerical Thinking
Scientific programming requires a different mindset.
Instead of asking:
“How do I calculate this value once?”
ask:
“How can I process the entire dataset automatically?”
For example, an engineer might receive thousands of temperature measurements. A scientific programmer thinks about how to load, clean, analyze, visualize, and report all measurements efficiently.
Step 3: Learn NumPy Arrays
Arrays are fundamental to scientific computing.
Practice:
- Creating arrays
- Selecting elements
- Reshaping data
- Combining arrays
- Performing vectorized operations
- Working with multidimensional data
This is an important transition from basic Python programming to numerical programming.
Step 4: Learn Data Handling
Use Pandas when your data resembles a table.
For example:
| Time | Temperature | Pressure | Flow |
|---|---|---|---|
| 09:00 | 21.4 | 101.2 | 4.1 |
| 10:00 | 22.8 | 101.5 | 4.5 |
| 11:00 | 24.1 | 101.8 | 4.9 |
| 12:00 | 25.7 | 102.0 | 5.2 |
A programmer can load this information, identify missing values, filter measurements, calculate statistics, and generate plots.
Step 5: Learn Visualization
A scientific result is much more useful when it can be communicated clearly.
Practice creating:
- Line plots
- Scatter plots
- Histograms
- Bar charts
- Heatmaps
- Contour plots
- 3D visualizations
Choose the visualization according to the scientific question rather than simply choosing the most attractive chart.
Step 6: Learn SciPy
After becoming comfortable with NumPy, begin exploring SciPy.
Useful areas include:
- Optimization
- Numerical integration
- Interpolation
- Signal processing
- Statistics
- Linear algebra
- Curve fitting
SciPy is designed to work closely with NumPy’s numerical structures.
Step 7: Build Complete Projects
This is where real learning begins.
Instead of studying isolated commands, create projects such as:
Sensor data → Cleaning → Analysis → Visualization → Report
or:
Engineering problem → Computational model → Simulation → Results → Interpretation
Projects expose you to realistic problems that tutorials often hide.
Comparison: Traditional Calculation vs Scientific Programming ⚖️
| Feature | Manual/Traditional Approach | Scientific Python |
|---|---|---|
| Repetitive calculations | Time-consuming | Automated |
| Large datasets | Difficult to manage | Efficiently processed |
| Visualization | Often separate | Integrated |
| Reproducibility | Can be difficult | Code provides a repeatable workflow |
| Parameter testing | Slow | Easy to automate |
| Data cleaning | Manual | Programmable |
| Simulation | Limited by manual work | Highly scalable |
| Documentation | Separate reports | Can combine code and explanation |
The important advantage is not simply speed.
A well-designed scientific program can make an analysis repeatable, auditable, and easier to modify.
Scientific Programming Workflow 🔄


A practical workflow can be represented as:
┌────────────────────┐
│ Scientific Problem │
└─────────┬──────────┘
          ↓
┌────────────────────┐
│ Collect / Import   │
│       Data         │
└─────────┬──────────┘
          ↓
┌────────────────────┐
│ Clean & Validate   │
│       Data         │
└─────────┬──────────┘
          ↓
┌────────────────────┐
│ Numerical Analysis │
│   NumPy / SciPy    │
└─────────┬──────────┘
          ↓
┌────────────────────┐
│ Visualization      │
│    Matplotlib      │
└─────────┬──────────┘
          ↓
┌────────────────────┐
│ Interpretation &   │
│ Engineering Report │
└────────────────────┘
This structure mirrors the way many scientific computing projects move from raw information toward an interpretable result. Scientific Python resources commonly emphasize data acquisition, processing, visualization, and communication as connected parts of the workflow.
Choosing the Right Library
| Task | Recommended Tool |
|---|---|
| Numerical arrays | NumPy |
| Scientific algorithms | SciPy |
| Tabular data | Pandas |
| Visualization | Matplotlib |
| Symbolic mathematics | SymPy |
| Interactive experiments | Jupyter |
| Machine learning | scikit-learn |
| Image processing | scikit-image |
The ecosystem is much larger than these tools, but these packages provide an excellent starting foundation.
Practical Examples 🔬
Example 1: Temperature Monitoring
Imagine a building contains sensors recording indoor temperature every minute.
A Python program can:
- Import the measurements.
- Detect missing records.
- Remove obvious data errors.
- Calculate daily statistics.
- Plot temperature changes.
- Identify unusual periods.
- Export a report.
The engineer does not need to inspect every measurement manually.
Example 2: Bridge Monitoring
A structural engineering team could collect vibration measurements from sensors installed on a bridge.
Python can organize the measurements, visualize vibration patterns, identify unusual signals, and help researchers investigate whether the structure is behaving differently from its normal operating condition.
Example 3: Renewable Energy
A solar-energy researcher could analyze historical production data.
Python can compare production across days, identify seasonal patterns, visualize performance, and help investigate relationships between environmental conditions and energy output.
Example 4: Laboratory Experiment
A researcher performing an experiment may collect measurements from several instruments.
Instead of manually transferring values into multiple spreadsheets, a Python workflow can automatically import the data, perform quality checks, generate plots, and produce a structured analysis.
Real-World Applications 🌎⚙️
Scientific Python is useful across many engineering and scientific fields.
Mechanical Engineering
Applications include:
- Thermal analysis
- Vibration analysis
- Experimental testing
- Machine performance monitoring
- Fluid-flow data analysis
Civil Engineering
Engineers can use Python for:
- Structural monitoring
- Geotechnical data analysis
- Traffic modeling
- Hydrology
- Construction data processing
Electrical Engineering
Scientific programming supports:
- Signal analysis
- Sensor processing
- Power-system studies
- Circuit data analysis
- Control-system experiments
Aerospace Engineering
Python can assist with:
- Flight-data analysis
- Simulation
- Optimization
- Trajectory studies
- Experimental data processing
Environmental Science
Researchers can analyze:
- Air-quality measurements
- Weather records
- Water-quality data
- Climate datasets
- Environmental sensor networks
Common Mistakes ⚠️
Learning Libraries Before Learning Programming
Memorizing NumPy commands without understanding Python fundamentals creates confusion.
Solution: Build basic programming skills first.
Ignoring Data Quality
A beautiful graph can still be scientifically meaningless if the underlying data is incorrect.
Solution: Validate units, missing values, outliers, timestamps, and sensor errors.
Using Loops for Everything
Beginners often process numerical arrays with unnecessary Python loops.
Solution: Learn NumPy’s array-oriented operations and vectorization.
Creating Misleading Visualizations
A graph can accidentally hide important information.
Solution: Label axes, include units, choose appropriate scales, and avoid unnecessary visual decoration.
Copying Code Without Understanding It
A program that runs is not necessarily a scientifically correct program.
Solution: Understand what every important operation is doing and verify results independently.
Ignoring Reproducibility
Changing values manually inside a spreadsheet makes an analysis difficult to reproduce.
Solution: Keep data-processing steps in scripts or notebooks and document assumptions.
Challenges & Solutions 🧠
| Challenge | Practical Solution |
|---|---|
| Python syntax feels difficult | Start with small engineering examples |
| Large datasets are slow | Learn NumPy arrays and efficient data structures |
| Confusing errors | Read error messages carefully and isolate the failing step |
| Too many libraries | Learn NumPy → Pandas → Matplotlib → SciPy progressively |
| Poor plots | Study visualization principles |
| Unreliable results | Validate against known or manually checked cases |
| Difficult projects | Break the workflow into smaller functions |
| Repeated code | Create reusable modules and functions |
Error messages should not automatically be treated as failures. They often provide clues about where and why a computational problem occurred.
Case Study: Automated Engineering Sensor Analysis 🏗️📊
Consider a hypothetical manufacturing facility monitoring a rotating machine.
Several sensors record vibration, temperature, and operating conditions throughout the day.
Initial Problem
Engineers previously examined exported spreadsheet data manually. When the number of measurements increased, identifying abnormal behavior became difficult.
Python Solution
A scientific Python workflow was developed:
Sensor files → Pandas → NumPy → Analysis → Matplotlib → Engineering report
Pandas handled the tabular measurements.
NumPy performed numerical operations.
SciPy provided specialized analysis routines where required.
Matplotlib generated trend and comparison plots.
Result
The engineering team could process new measurement files using the same workflow.
Instead of repeatedly performing the same manual operations, engineers could focus more attention on interpreting the results.
Important Lesson
The biggest benefit was not simply automation.
The workflow created a repeatable analysis procedure. If another dataset arrived, the same processing pipeline could be applied again.
That principle is fundamental to professional scientific programming.
Essential Tips for Beginners and Professionals 💡
Start With Engineering Problems
If you are studying mechanical engineering, analyze mechanical data.
If you are studying civil engineering, work with structural or environmental datasets.
Context makes programming easier to understand.
Learn One Tool at a Time
Do not attempt to master every scientific Python package simultaneously.
A practical progression is:
Python → NumPy → Pandas → Matplotlib → SciPy → Specialized libraries
Use Jupyter for Exploration
Jupyter is excellent for experimentation because you can combine explanations, code, outputs, and visualizations in one document.
Use Scripts for Reusable Work
When an analysis becomes stable and repetitive, move important logic into Python modules or scripts.
Validate Your Results
Never assume that a result is correct because Python produced it.
Compare results against:
- Known values
- Experimental observations
- Alternative methods
- Published reference data
- Simplified test cases
Document Assumptions
Scientific calculations often depend on assumptions.
Record:
- Units
- Input sources
- Data-cleaning decisions
- Model assumptions
- Software versions
- Important parameters
Learn to Read Documentation
Professional programmers do not memorize every function.
They know how to find reliable documentation and determine whether a function is appropriate for a specific problem.
FAQs ❓
What is scientific programming with Python?
Scientific programming with Python is the use of Python and scientific libraries to analyze data, perform numerical computations, create simulations, visualize results, and solve scientific or engineering problems.
Is Python difficult for engineering students?
Python is generally approachable for beginners because its syntax is relatively readable. The bigger challenge is learning computational thinking and understanding how programming relates to engineering concepts.
Should I learn Python before NumPy?
Yes. You should understand basic Python concepts before working extensively with NumPy. However, you do not need advanced Python knowledge before beginning numerical computing.
Is NumPy better than normal Python lists?
For numerical workloads, NumPy arrays provide specialized structures and operations designed for numerical computing. They are particularly valuable when working with large multidimensional datasets.
Why is SciPy important?
SciPy provides ready-to-use scientific and numerical algorithms for areas such as optimization, statistics, integration, interpolation, signal processing, and scientific analysis.
Should engineers learn Pandas?
Yes, especially if they regularly work with experimental data, CSV files, spreadsheets, sensor records, or time-series measurements.
Is Jupyter necessary for scientific programming?
No, it is not mandatory. However, Jupyter is extremely useful for interactive experimentation, teaching, data analysis, documentation, and research workflows.
How long does it take to learn scientific Python?
The answer depends on your programming and mathematical background. A motivated beginner can start performing useful analyses relatively quickly, while advanced scientific programming requires longer-term practice with numerical methods, software engineering, statistics, and domain-specific modeling.
Conclusion 🚀🐍
Learning scientific programming with Python is not simply about learning another programming language. It is about developing a computational approach to scientific and engineering problems.
Python provides the programming foundation, while NumPy supplies powerful numerical arrays, Pandas simplifies structured data analysis, Matplotlib communicates results visually, and SciPy adds sophisticated scientific algorithms. Jupyter connects these capabilities into an interactive environment suitable for experimentation and documentation.
For beginners, the best strategy is to progress gradually:
Python fundamentals → numerical arrays → data analysis → visualization → scientific algorithms → complete projects.
For professionals, the focus should move toward reproducibility, validation, performance, automation, testing, and maintainable scientific software.
The most valuable skill is ultimately not memorizing library commands. It is learning how to transform a real-world scientific question into a reliable computational workflow.
When that skill develops, Python becomes more than a programming language—it becomes a practical engineering laboratory inside your computer. 🔬💻⚙️