
Real-World SQL for Analysts: 90 Practice Problems to Get You Job-Ready — A Practical Guide to SQL Skills for Data Analysts
Introduction
SQL is one of the most valuable technical skills for modern data analysts. Whether you are working in finance, engineering, healthcare, retail, logistics, marketing, or technology, organizations generate enormous quantities of structured data every day.
Knowing SQL syntax, however, is not the same as being job-ready. A professional analyst must be able to transform a business question into a SQL query, combine information from multiple tables, detect data-quality problems, calculate meaningful metrics, and communicate the results clearly.
That is where a practical resource such as Real-World SQL for Analysts: 90 Practice Problems to Get You Job-Ready becomes particularly useful. Instead of treating SQL as a collection of isolated commands, a problem-driven approach encourages analysts to think in terms of actual datasets, business requirements, and analytical decisions.


A useful SQL learning cycle looks like this:
Business Question → Data Exploration → SQL Query → Validation → Analysis → Insight → Decision
For beginners, this process builds confidence. For experienced professionals, it reinforces the analytical habits required when working with messy production data. 🚀
Background Theory
Why SQL remains essential for analysts
SQL, or Structured Query Language, is designed for interacting with relational databases. Although modern analytics environments include Python, R, spreadsheets, BI platforms, and cloud data warehouses, SQL remains the language used to retrieve and transform much of the underlying data.
A typical company may store information in tables such as:
customersordersproductsemployeestransactionspaymentsweb_events
These tables can contain millions or billions of records.
Instead of manually examining thousands of rows, an analyst can use SQL to answer questions such as:
Which products generated the most revenue last quarter?
Which customers have not purchased anything during the last 90 days?
What is the average order value by country?
Which employees are generating the highest sales?
The ability to answer these questions efficiently is what makes SQL valuable professionally.
From syntax to analytical thinking
Learning SELECT, WHERE, and ORDER BY is only the beginning.
A job-ready analyst must understand:
Data → Relationships → Conditions → Aggregation → Business Logic → Validation
For example, calculating revenue may look simple:
Revenue = Quantity × Unit Price
But real databases introduce additional questions:
- Are cancelled orders included?
- Are refunds deducted?
- Is tax included?
- Are duplicate transactions present?
- Which currency is being used?
- What happens when
quantityisNULL?
This is why practice problems based on realistic scenarios are much more valuable than memorizing syntax alone.
Definition
What is real-world SQL analysis?
Real-world SQL analysis is the process of using SQL to retrieve, clean, transform, aggregate, compare, and interpret structured data to solve practical business or engineering problems.
It typically involves several SQL concepts:
| SQL Concept | Purpose | Typical Analyst Use |
|---|---|---|
SELECT | Retrieve columns | Inspect datasets |
WHERE | Filter records | Find qualifying rows |
GROUP BY | Aggregate data | Revenue by region |
HAVING | Filter groups | Customers with high spending |
JOIN | Combine tables | Orders + customers |
CASE | Apply logic | Customer segmentation |
| Subqueries | Nested analysis | Compare against averages |
| CTEs | Organize queries | Multi-stage analysis |
| Window functions | Analyze rows comparatively | Rankings and trends |
| Date functions | Handle time | Monthly reporting |
What does “job-ready” mean?
Being job-ready does not mean knowing every SQL function.
It means being able to take an unfamiliar dataset and systematically determine:
- What the tables represent.
- How tables are related.
- Which columns are relevant.
- What the business question means mathematically.
- 🐍 How to construct the query.
- How to verify the result.
- How to explain the result.
That analytical reasoning is often more important than remembering the exact syntax of an obscure function.
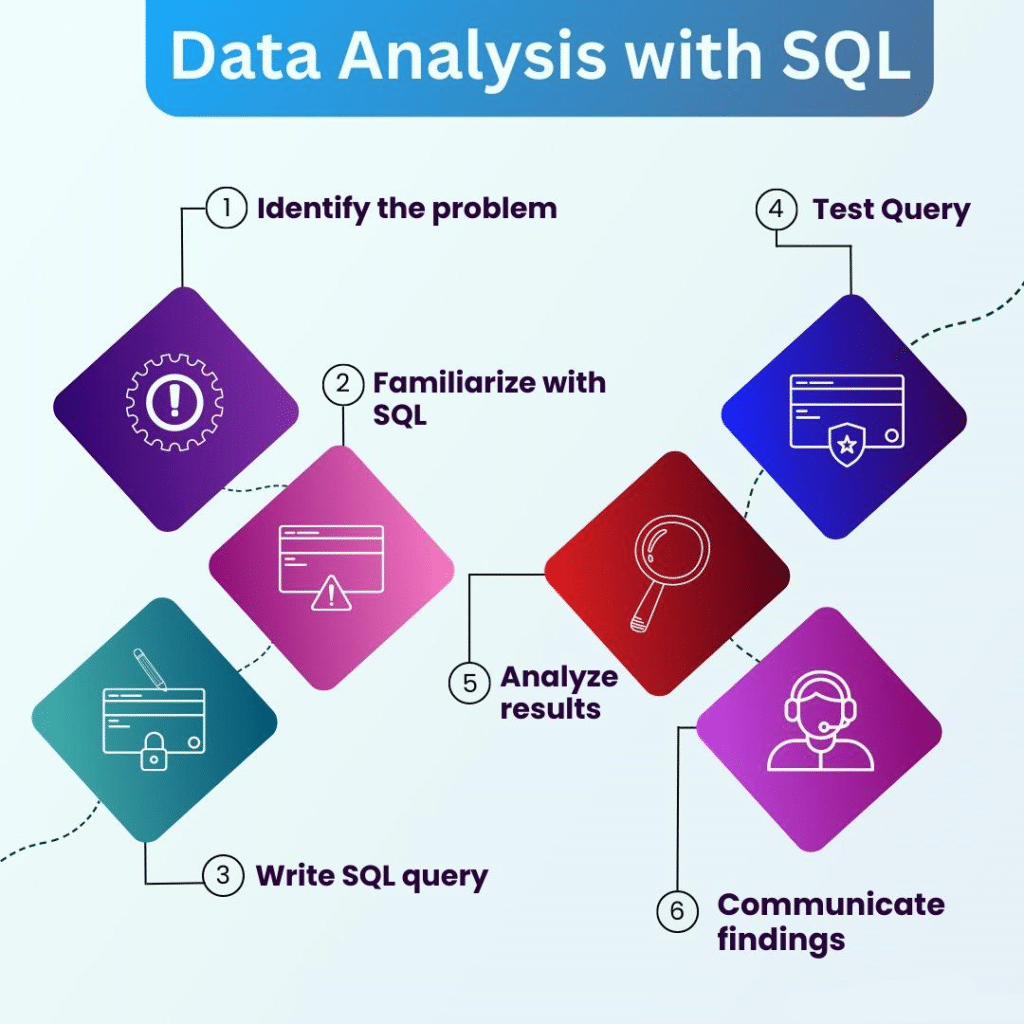
Step-by-Step SQL Problem-Solving Workflow
Step 1: Understand the business question
Never begin by writing SQL immediately.
Suppose a manager asks:
“Which customers are most valuable?”
That question is ambiguous.
Does “valuable” mean:
- highest revenue?
- highest profit?
- most orders?
- longest relationship?
- highest average order value?
First define the metric.
Step 2: Inspect the database
Identify relevant tables and columns.
For example:
customers
---------
customer_id
customer_name
country

orders
------
order_id
customer_id
order_date
total_amount
status
The relationship is:
customers.customer_id → orders.customer_id
Step 3: Build the basic query
SELECT
    c.customer_id,
    c.customer_name,
    SUM(o.total_amount) AS total_revenue
FROM customers c
JOIN orders o
    ON c.customer_id = o.customer_id
WHERE o.status = 'Completed'
GROUP BY
    c.customer_id,
    c.customer_name;
Step 4: Rank the results
ORDER BY total_revenue DESC;
Now the highest-value customers appear first.
Step 5: Validate the output
Check:
- Does the number of customers make sense?
- 🐍 Are cancelled orders excluded?
- 🐍 Are duplicates inflating revenue?
- Are customers with no orders expected?
- Are
NULLvalues handled correctly?
Step 6: Convert the result into an insight
SQL produces a result. Analysis produces meaning.
For example:
“The top 10 customers generated 31% of completed-order revenue, indicating a significant concentration of revenue among a small customer segment.”
That statement is far more valuable to a decision-maker than simply displaying a SQL table.




Comparison: Basic SQL Learning vs Real-World Practice
Syntax-first learning
Traditional learning often follows this sequence:
SELECT → WHERE → GROUP BY → JOIN → Subquery
This is useful for understanding fundamentals, but it can become disconnected from real analytical work.
Problem-first learning
A practical approach reverses the process:
Business Problem → Data → Required Metric → SQL Technique → Validation → Insight
| Approach | Syntax-Based | Problem-Based |
|---|---|---|
| Main focus | Commands | Business questions |
| Learning style | Memorization | Reasoning |
| Data complexity | Usually low | Realistic |
| Error detection | Limited | Essential |
| Business context | Minimal | Strong |
| Interview preparation | Moderate | High |
| Professional transfer | Moderate | Excellent |
Why 90 practice problems matter
A collection of 90 problems can expose an analyst to many different analytical patterns.
For example:
- filtering
- aggregation
- joins
- subqueries
- date analysis
- customer analysis
- sales analysis
- ranking
- retention
- segmentation
- data cleaning
- performance analysis
The objective should not be to memorize 90 solutions.
The objective is to recognize recurring patterns.
Diagrams, Tables, and SQL Patterns
The relational model


A simplified analytical database might look like:
CUSTOMERS
   │
   │ customer_id
   ▼
ORDERS
   │
   │ order_id
   ▼
ORDER_ITEMS
   │
   │ product_id
   ▼
PRODUCTS
This structure demonstrates why JOIN is fundamental.
Common SQL analytical patterns
| Analytical Question | SQL Technique |
|---|---|
| Which rows match a condition? | WHERE |
| What is total revenue? | SUM() |
| What is average revenue? | AVG() |
| How many customers exist? | COUNT() |
| Which products rank highest? | RANK() |
| What happened last month? | Date functions |
| Which customers exceed average spending? | Subquery/CTE |
| Compare current vs previous month | Window functions |
| Categorize customers | CASE |
| Combine customer and order data | JOIN |
Window functions
Window functions are particularly important for professional analytics.
For example:
SELECT
    customer_id,
    order_date,
    total_amount,
    SUM(total_amount) OVER (
        PARTITION BY customer_id
    ) AS customer_total
FROM orders;
Unlike GROUP BY, a window function can calculate an aggregate while keeping individual rows visible.
That makes window functions extremely useful for:
- rankings
- running totals
- comparisons
- moving averages
- customer behavior
- time-series analysis
Examples
Example 1: Find high-value customers
SELECT
    customer_id,
    SUM(total_amount) AS revenue
FROM orders
WHERE status = 'Completed'
GROUP BY customer_id
HAVING SUM(total_amount) > 10000
ORDER BY revenue DESC;
This identifies customers generating more than 10,000 units of revenue.
Example 2: Monthly sales
SELECT
    DATE_TRUNC('month', order_date) AS month,
    SUM(total_amount) AS revenue
FROM orders
WHERE status = 'Completed'
GROUP BY DATE_TRUNC('month', order_date)
ORDER BY month;
The exact date function varies between PostgreSQL, SQL Server, MySQL, Oracle, and other database systems.
Example 3: Product ranking
SELECT
    product_id,
    SUM(quantity) AS units_sold,
    RANK() OVER (
        ORDER BY SUM(quantity) DESC
    ) AS sales_rank
FROM order_items
GROUP BY product_id;
This transforms raw transactions into a ranked product-performance report.
Real-World Applications
Business intelligence
SQL is frequently used behind dashboards that monitor:
- revenue
- profit
- customer acquisition
- conversion
- inventory
- operational KPIs
Financial analysis
Financial analysts can use SQL to investigate:
- transaction volumes
- expenses
- revenue trends
- payment failures
- account activity
- financial anomalies
Engineering analytics
Engineering organizations can apply SQL to:
- equipment measurements
- production records
- maintenance events
- sensor data
- quality-control results
- project performance
Marketing analytics
Marketing teams can analyze:
- campaign performance
- customer segments
- conversion rates
- acquisition channels
- repeat purchases
- customer lifetime value
Data science
SQL also serves as a foundation for machine-learning workflows.
Before a model is trained, analysts and data scientists often need to create a reliable analytical dataset.
A simplified pipeline is:
Database → SQL Transformation → Feature Dataset → Python/R → Model → Evaluation
Common Mistakes
Using SELECT * everywhere
Although convenient during exploration, SELECT * can retrieve unnecessary columns and make analytical queries harder to understand.
Prefer:
SELECT customer_id, customer_name, country
FROM customers;
Incorrect joins
An incorrect join can silently multiply rows and produce completely wrong results.
For example, joining tables without understanding their cardinality can cause revenue to appear several times larger than reality.
⚠️ Always understand the relationship between tables before joining them.
Filtering at the wrong stage
There is an important difference between:
WHERE
and:
HAVING
WHERE filters rows before aggregation.
HAVING filters groups after aggregation.
Ignoring NULL values
NULL is not the same as zero.
For example:
AVG(score)
may behave differently from what a beginner expects when missing values exist.
Forgetting duplicate records
Production databases may contain duplicate events, repeated imports, or multiple records representing the same business event.
Always investigate unexpected counts.
Challenges & Solutions
| Challenge | Solution |
|---|---|
| Large datasets | Filter early and select necessary columns |
| Complicated joins | Draw the table relationships first |
| Duplicate rows | Check keys and join cardinality |
| Missing values | Define explicit NULL handling |
| Slow queries | Inspect indexes and query plans |
| Confusing logic | Break queries into CTEs |
| Inconsistent dates | Standardize date/time handling |
| Wrong metrics | Define business logic before coding |
Query performance
A correct SQL query can still be inefficient.
For large datasets, analysts should understand concepts such as:
- indexes
- execution plans
- partitioning
- predicate filtering
- query pruning
- aggregation cost
- join strategies
Modern cloud warehouses may also charge based on data processed, making efficient SQL both a technical and financial consideration. 💡
Case Study: E-Commerce Revenue Analysis
Imagine an international e-commerce company operating in the United States, Canada, the United Kingdom, Australia, and Europe.
The company wants to identify regions with strong sales but poor customer retention.
Stage 1: Revenue
The analyst calculates regional revenue:
SELECT
    c.country,
    SUM(o.total_amount) AS revenue
FROM customers c
JOIN orders o
    ON c.customer_id = o.customer_id
WHERE o.status = 'Completed'
GROUP BY c.country
ORDER BY revenue DESC;
Stage 2: Repeat customers
The analyst then counts customers with multiple completed orders.
SELECT
    customer_id,
    COUNT(*) AS order_count
FROM orders
WHERE status = 'Completed'
GROUP BY customer_id
HAVING COUNT(*) > 1;
Stage 3: Business interpretation
Suppose one region generates excellent first-time sales but has a low repeat-purchase rate.
The SQL result alone does not solve the business problem.
The analyst might recommend investigating:
- shipping experience
- pricing
- product quality
- customer support
- competitor activity
- return policies
This illustrates the central lesson:
SQL finds patterns; analysts explain why those patterns matter.
Essential Tips
Build a SQL portfolio
Create projects based on realistic datasets.
Good portfolio projects include:
- e-commerce analytics
- financial transactions
- logistics
- employee analytics
- marketing campaigns
- manufacturing
- customer retention
Practice without immediately checking solutions
When solving a problem, first attempt it independently.
If you get stuck, identify the missing concept rather than simply copying the answer.
Learn multiple ways to solve a problem
For example, a problem might be solved using:
- a subquery
- a CTE
- a window function
- conditional aggregation
Comparing approaches develops deeper SQL intuition.
Learn database-specific differences
SQL is standardized, but implementations differ.
Important ecosystems include:
- PostgreSQL
- MySQL
- Microsoft SQL Server
- Oracle Database
- SQLite
- BigQuery
- Snowflake
A professional analyst should know the general SQL concepts while becoming comfortable with the platform used by their organization.
Think like an interviewer
When solving a SQL interview problem, explain your reasoning.
Don’t simply produce:
SELECT ...
Explain:
“First I identify the grain of the dataset, then join customers to transactions, filter invalid records, aggregate revenue, and finally rank the customers.”
That demonstrates analytical maturity. 🧠
FAQs
Is SQL difficult for beginners?
SQL is relatively approachable because its syntax resembles natural language. The difficult part is usually not basic syntax but understanding relationships between tables, aggregation, joins, and analytical logic.
How many SQL problems should an analyst practice?
There is no magic number. However, working through a broad collection such as 90 realistic problems can expose you to many recurring patterns and provide substantially more variety than memorizing a small set of examples.
Should I learn SQL before Python?
For many data-analyst roles, SQL is an excellent first technical skill because analysts frequently need to retrieve and transform data before using Python or another analytical tool.
Are SQL joins important for data analysts?
Absolutely. Real business data is commonly distributed across multiple related tables. Understanding INNER JOIN, LEFT JOIN, and join cardinality is essential.
Are window functions necessary?
They are not required for basic SQL, but they are extremely valuable for professional analytics. Ranking, running totals, period comparisons, and customer-level calculations often become much easier with window functions.
Can SQL alone get me a data analyst job?
SQL can be one of the most important skills, but many analyst positions also expect spreadsheet skills, data visualization, statistics, communication, and business understanding. The exact requirements depend on the role.
Should I memorize SQL queries?
No. Memorize fundamental patterns and concepts instead. A strong analyst should be able to reconstruct a query from the business requirement.
What makes a SQL practice problem realistic?
A realistic problem has context, imperfect data, relationships between tables, a measurable objective, and a result that could influence a business or engineering decision.
Conclusion
Real-World SQL for Analysts: 90 Practice Problems to Get You Job-Ready represents an important idea in SQL education: becoming proficient requires more than memorizing commands.
The strongest analysts learn to move from a vague business question to a precise analytical definition, discover the correct data, construct a reliable query, validate the result, and communicate the insight.
The progression can be summarized as:
SQL Syntax → Query Construction → Data Reasoning → Analytical Thinking → Business Insight 🚀
For students, realistic practice problems provide a bridge between classroom exercises and professional work. For experienced engineers and analysts, they provide an opportunity to strengthen query design, performance awareness, and analytical reasoning.
Ultimately, SQL is not simply a database language. It is a powerful tool for asking structured questions about the world of data.
And when those questions are connected to realistic problems, SQL practice becomes much more than coding—it becomes professional analytical training.




