Introduction to Modern Statistics: Complete Guide to Statistical Thinking, Data Analysis, Probability, and Real-World Applications 📊📈🚀
Introduction 📊✨
Statistics is one of the most important disciplines in the modern world. From artificial intelligence and engineering to healthcare, finance, manufacturing, and scientific research, statistics helps professionals transform raw data into meaningful insights.
In today’s data-driven era, organizations collect massive amounts of information every second. However, data alone has little value unless it can be analyzed, interpreted, and transformed into actionable knowledge. Modern statistics provides the mathematical and analytical framework required to achieve this goal.
Whether you are an engineering student, data scientist, researcher, project manager, or business analyst, understanding modern statistics is essential for making informed decisions. Statistical methods allow us to identify patterns, measure uncertainty, predict outcomes, and evaluate performance with scientific accuracy.
📌 Key reasons why statistics is important:
- Supports evidence-based decision making
- Reduces uncertainty and risk
- Improves product quality
- Enhances scientific research
- Powers machine learning and AI systems
- Helps engineers optimize designs and processes
- Enables forecasting and predictive analytics
Modern statistics combines traditional statistical theory with computational techniques, machine learning algorithms, and big data analytics to address increasingly complex problems.
Background Theory 🧠📚
The origins of statistics can be traced back thousands of years when governments collected population and taxation records. However, statistical science began evolving significantly during the 17th and 18th centuries through the work of mathematicians and scientists.
Early Development of Statistics
The foundation of modern statistics emerged from probability theory developed by pioneers such as:
- Blaise Pascal
- Pierre de Fermat
- Jacob Bernoulli
- Thomas Bayes
- Carl Friedrich Gauss
These researchers established mathematical principles for analyzing uncertainty and random events.
Evolution into Modern Statistics
As technology advanced, statistics evolved from simple descriptive methods into a comprehensive scientific discipline capable of handling massive datasets.
Modern statistics integrates:
✅ Probability Theory
✅ Mathematical Modeling
🚀 Computational Methods
✅ Machine Learning
✅ Artificial Intelligence
🚀 Big Data Analytics
Today, statistical analysis drives innovation across virtually every engineering and scientific field.
Technical Definition ⚙️📐
Statistics is the scientific discipline concerned with collecting, organizing, analyzing, interpreting, presenting, and drawing conclusions from data.
In technical terms:
Statistics is the branch of mathematics that uses quantitative models to describe variability, uncertainty, relationships, and patterns within data.
Statistics can be broadly divided into two major categories:
| Category | Purpose |
|---|---|
| Descriptive Statistics | Summarizes and organizes data |
| Inferential Statistics | Draws conclusions about populations from samples |
Modern statistics extends these categories with predictive and computational approaches.
Fundamental Components of Modern Statistics 🔍
Population
A population represents the entire group being studied.
Examples:
- All vehicles produced by a manufacturer
- Every patient in a clinical study
- All internet users in a country
Sample
A sample is a subset of the population selected for analysis.
Example:
- Testing 1,000 vehicles out of 1 million produced
Variable
A variable is a measurable characteristic.
Examples:
- Temperature
- Pressure
- Voltage
- Income
- Height
Observation
Each recorded measurement is called an observation.
Parameter
A parameter describes a population characteristic.
Examples:
- Population mean
- Population variance
Statistic
A statistic describes a sample characteristic.
Examples:
- Sample mean
- Sample standard deviation
Step-by-Step Explanation of Statistical Analysis 🔬📊
Step 1: Define the Problem
Every statistical study begins with a clear objective.
Examples:
- Improve manufacturing quality
- Predict equipment failure
- Analyze customer behavior
Questions should be specific and measurable.
Step 2: Collect Data
Data collection methods include:
Surveys
Gather information from participants.
Experiments
Control variables to measure effects.
Sensors
Common in engineering systems.
Databases
Extract historical records.
IoT Devices
Generate real-time operational data.
Step 3: Clean the Data 🧹
Raw data often contains:
- Missing values
- Duplicate records
- Measurement errors
- Outliers
Data cleaning improves analysis accuracy.
Step 4: Organize the Data
Techniques include:
- Tables
- Frequency distributions
- Histograms
- Scatter plots
- Box plots
Proper organization reveals patterns more clearly.
Step 5: Perform Descriptive Analysis
Common measures include:
Mean
Average value.
Formula:
Mean=∑X/n
Median
Middle value after sorting.
Mode
Most frequently occurring value.
Range
Difference between maximum and minimum.
Variance
Measures spread around the mean.
Standard Deviation
Represents typical variation.
Step 6: Conduct Inferential Analysis
Inferential statistics allows conclusions about populations.
Common methods:
- Confidence intervals
- Hypothesis testing
- Regression analysis
- ANOVA
- Bayesian inference
Step 7: Interpret Results
Statistical significance must be interpreted carefully.
Important considerations:
- Practical significance
- Sample size
- Confidence levels
- Assumptions
Step 8: Make Decisions
The ultimate goal of statistics is decision support.
Examples:
🚀 Launch a product
⚙️ Improve a process
🏥 Approve a treatment
💰 Invest capital
Descriptive Statistics Explained 📈
Descriptive statistics summarizes data characteristics.
Measures of Central Tendency
| Measure | Description |
|---|---|
| Mean | Average value |
| Median | Middle value |
| Mode | Most frequent value |
Measures of Dispersion
| Measure | Description |
|---|---|
| Range | Maximum minus minimum |
| Variance | Spread around mean |
| Standard Deviation | Average variability |
Shape Measures
Skewness
Measures asymmetry.
Kurtosis
Measures tail heaviness.
Inferential Statistics Explained 🎯
Inferential statistics uses sample information to estimate population properties.
Confidence Intervals
A confidence interval provides a range likely containing the true parameter.
Example:
95% Confidence Interval:
120 ± 5
Interpretation:
The population parameter likely falls between 115 and 125.
Hypothesis Testing
Used to evaluate claims.
Null Hypothesis (H₀)
Assumes no effect.
Alternative Hypothesis (H₁)
Assumes an effect exists.
Decision outcomes:
- Reject H₀
- Fail to reject H₀
P-Value
The p-value measures evidence against the null hypothesis.
Typical threshold:
p<0.05
Lower values indicate stronger evidence.
Probability Theory in Modern Statistics 🎲
Probability forms the backbone of statistics.
Basic Probability Formula
P(A)=Favorable Outcomes/Total Outcomes
Important Probability Distributions
Normal Distribution 🔔
Characteristics:
- Bell-shaped
- Symmetrical
- Widely observed in nature
Examples:
- Human height
- Measurement errors
- Test scores
Binomial Distribution
Used when:
- Two possible outcomes exist
- Repeated trials occur
Examples:
- Pass or fail
- Success or failure
Poisson Distribution
Models rare events.
Examples:
- System failures
- Website visits
- Equipment breakdowns
Exponential Distribution
Models waiting times.
Examples:
- Time between failures
- Customer arrivals
Statistical Modeling 📉🤖
Modern statistics relies heavily on mathematical models.
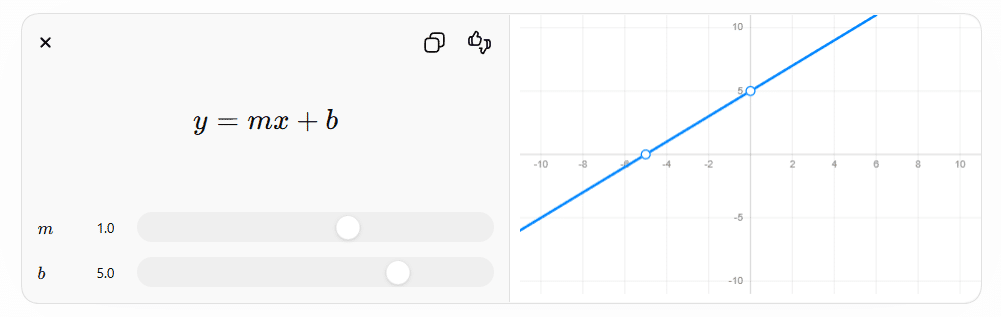
Linear Regression
Used to model relationships between variables.
Applications:
- Cost prediction
- Demand forecasting
- Performance analysis
Multiple Regression
Uses multiple predictors.
Example:
Predicting energy consumption using:
- Temperature
- Humidity
- Occupancy
Logistic Regression
Used for classification.
Outputs probabilities between:
0 and 1
Examples:
- Disease diagnosis
- Fraud detection
Comparison: Traditional vs Modern Statistics ⚖️
| Feature | Traditional Statistics | Modern Statistics |
|---|---|---|
| Data Size | Small | Massive |
| Computation | Manual | Automated |
| Processing Speed | Slow | Fast |
| Tools | Calculators | AI Platforms |
| Focus | Description | Prediction |
| Applications | Research | Real-Time Analytics |
| Complexity | Moderate | High |
Key Differences
Traditional statistics focused on understanding historical data.
Modern statistics focuses on:
- Prediction
- Automation
- Real-time decision making
- Machine learning integration
Diagrams & Tables 📋
Statistical Workflow Diagram
Problem Definition
        ↓
Data Collection
        ↓
Data Cleaning
        ↓
Data Exploration
        ↓
Statistical Analysis
        ↓
Interpretation
        ↓
Decision Making
Types of Data
| Data Type | Example |
|---|---|
| Numerical | Temperature |
| Categorical | Color |
| Ordinal | Rankings |
| Binary | Yes / No |
Statistical Methods Table
| Method | Purpose |
|---|---|
| Mean | Central tendency |
| Regression | Prediction |
| ANOVA | Group comparison |
| Chi-Square | Association testing |
| Bayesian Analysis | Probability updating |
Examples 📚✨
Example 1: Manufacturing Quality Control
An engineer measures bolt diameters.
Sample size:
100 bolts
Mean diameter:
10 mm
Standard deviation:
0.05 mm
Statistics identifies whether production remains within tolerance limits.
Example 2: Website Analytics
A company records:
- Daily visitors
- Conversion rates
- Session durations
Statistical analysis identifies user behavior patterns.
Example 3: Energy Consumption
A utility company predicts future electricity demand using:
- Historical consumption
- Weather conditions
- Population growth
Regression models improve forecasting accuracy.
Real World Applications 🌍⚙️
Modern statistics impacts nearly every industry.
Engineering
Applications include:
- Reliability analysis
- Process optimization
- Quality control
- Failure prediction
Healthcare
Used for:
🏥 Clinical trials
🩺 Disease modeling
💉 Drug development
📊 Public health studies
Finance
Supports:
💰 Risk management
📈 Portfolio optimization
🏦 Credit scoring
📉 Market forecasting
Artificial Intelligence
Statistics powers:
🤖 Machine Learning
🧠 Neural Networks
🎯 Recommendation Systems
🔍 Computer Vision
Manufacturing
Applications:
⚙️ Six Sigma
🏭 Statistical Process Control
🔧 Predictive Maintenance
📦 Supply Chain Optimization
Environmental Engineering
Used for:
🌱 Climate modeling
🌊 Water quality assessment
🌍 Sustainability analysis
Common Mistakes ❌
Confusing Correlation with Causation
Just because two variables move together does not mean one causes the other.
Ignoring Sample Bias
Poor sampling produces misleading conclusions.
Using Small Samples
Small datasets often generate unreliable estimates.
Misinterpreting P-Values
Statistical significance does not guarantee practical importance.
Ignoring Assumptions
Many statistical methods require assumptions regarding:
- Independence
- Normality
- Homogeneity
Violation can invalidate results.
Challenges and Solutions 🛠️
Challenge 1: Big Data Complexity
Modern datasets are enormous.
Solution
Use:
- Cloud computing
- Distributed databases
- Advanced analytics platforms
Challenge 2: Missing Data
Missing observations reduce accuracy.
Solution
Apply:
- Data imputation
- Statistical estimation
- Improved collection methods
Challenge 3: Data Quality
Inaccurate data produces inaccurate conclusions.
Solution
Implement:
- Validation procedures
- Data governance
- Quality assurance systems
Challenge 4: Model Overfitting
Models may memorize rather than generalize.
Solution
Use:
- Cross-validation
- Regularization
- Independent test datasets
Case Study: Statistical Quality Control in Manufacturing 🏭📊
Problem
A manufacturing facility experienced increased defect rates.
Defect percentage:
4.8%
Target:
Less than 2%
Data Collection
Engineers collected:
- Machine settings
- Temperature data
- Material quality information
- Operator records
Statistical Analysis
Methods used:
- Control charts
- Regression analysis
- Hypothesis testing
Results revealed a strong relationship between machine temperature and defect occurrence.
Solution Implemented
Engineers:
📊 Installed automated temperature monitoring
✅ Adjusted process parameters
✅ Improved maintenance schedules
Outcome
Results after implementation:
| Metric | Before | After |
|---|---|---|
| Defect Rate | 4.8% | 1.7% |
| Productivity | 100% | 112% |
| Customer Complaints | High | Low |
The statistical approach significantly improved operational performance.
Tips for Engineers 👷♂️🚀
Understand the Data First
Never begin modeling before exploring the data.
Visualize Everything
Charts often reveal patterns hidden in tables.
Learn Probability Thoroughly
Probability is the foundation of all statistical reasoning.
Focus on Practical Significance
Business value matters as much as statistical significance.
Validate Assumptions
Check assumptions before applying advanced methods.
Master Statistical Software
Useful tools include:
- Python
- R
- MATLAB
- Excel
- SPSS
- SAS
Keep Learning
Statistics continuously evolves through:
- Machine learning
- AI
- Deep learning
- Big data technologies
Frequently Asked Questions (FAQs) ❓
1. What is modern statistics?
Modern statistics combines traditional statistical theory with computational methods, machine learning, and big data analytics to extract insights from complex datasets.
2. Why is statistics important in engineering?
Statistics helps engineers improve quality, optimize processes, predict failures, and make data-driven decisions.
3. What is the difference between descriptive and inferential statistics?
Descriptive statistics summarizes data, while inferential statistics draws conclusions about populations using sample data.
4. What is a p-value?
A p-value measures evidence against a null hypothesis. Smaller values indicate stronger evidence.
5. Is statistics required for artificial intelligence?
Yes. Machine learning and AI rely heavily on probability, statistical inference, and optimization methods.
6. What software is commonly used for statistics?
Popular tools include Python, R, MATLAB, Excel, SAS, SPSS, and cloud analytics platforms.
7. What is the most important concept in statistics?
Many experts consider probability theory the foundation of modern statistical analysis.
8. Can statistics predict the future?
Statistics cannot predict the future with certainty, but it can estimate likely outcomes and quantify uncertainty.
Conclusion 🎯📊🚀
Modern statistics has become one of the most influential scientific disciplines of the 21st century. It provides the essential tools needed to understand data, measure uncertainty, identify patterns, and support informed decision making. From engineering and healthcare to finance, artificial intelligence, and environmental science, statistical methods are fundamental to innovation and progress.
For students, mastering statistics opens doors to careers in engineering, data science, research, and technology. For professionals, statistical thinking improves analytical capabilities, enhances problem-solving skills, and supports evidence-based decision making.
As organizations continue generating unprecedented volumes of data, the importance of modern statistics will only increase. Engineers and analysts who develop strong statistical foundations will be better equipped to solve complex challenges, create innovative solutions, and drive technological advancement in the decades ahead. 🌟📈🔬⚙️


