Mathematical Statistics with Applications in R 📊🔢 | Complete Guide for Data Analysis, Probability, and Statistical Computing
Introduction 🚀
Mathematical statistics is one of the most important branches of modern science, engineering, economics, artificial intelligence, and data analytics. It provides the theoretical foundation for making decisions based on data rather than assumptions. Whether an engineer is designing a bridge, a healthcare researcher is testing a new treatment, or a data scientist is building predictive models, mathematical statistics plays a crucial role.
With the rise of big data and machine learning, statistical analysis has become a core skill for engineers and researchers worldwide. The R programming language has emerged as one of the most powerful tools for statistical computing because it combines mathematical rigor with practical implementation.
Today, organizations across the United States, United Kingdom, Canada, Australia, and Europe rely heavily on statistical techniques implemented in R to solve complex real-world problems.
This comprehensive guide explores mathematical statistics, its theoretical foundations, practical applications, implementation in R, common challenges, and best practices for students and professionals.
Background Theory 📚
Mathematical statistics evolved from probability theory and provides methods for analyzing uncertainty using mathematical models.
Origins of Probability Theory
The foundations of statistics began with studies of gambling problems during the seventeenth century. Mathematicians developed probability laws to predict outcomes of random events.
Key contributors include:
- Blaise Pascal
- Pierre de Fermat
- Jacob Bernoulli
- Thomas Bayes
Their work established the mathematical framework used today in statistical inference.
Relationship Between Probability and Statistics
Probability starts with a known model and predicts future outcomes.
Statistics starts with observed data and attempts to infer the underlying model.
For example:
- Probability asks: “What is the chance of getting heads?”
- Statistics asks: “Based on observed flips, what is the probability of heads?”
Why Statistics Matters in Engineering
Engineers rarely work with perfect information.
Real-world measurements contain:
- Noise
- Errors
- Variability
- Uncertainty
Statistics helps engineers:
✅ Analyze experimental data
✅ Improve product quality
🚀 Predict failures
✅ Optimize systems
✅ Support decision-making
Technical Definition ⚙️
Mathematical statistics is the branch of applied mathematics that develops statistical methods using probability theory to collect, analyze, interpret, and draw conclusions from data.
Its primary goals are:
- Data description
- Parameter estimation
- Hypothesis testing
- Prediction
- Decision-making under uncertainty
Mathematical statistics combines:
| Component | Purpose |
|---|---|
| Probability Theory | Models randomness |
| Linear Algebra | Data representation |
| Calculus | Optimization |
| Numerical Methods | Computation |
| Programming | Implementation |
Core Concepts of Mathematical Statistics 🧠
Population and Sample
A population represents the entire group of interest.
Examples:
- All vehicles manufactured in a factory
- Every patient in a hospital system
- All students in a university
A sample is a subset selected from the population.
Example:
- 500 vehicles inspected from 100,000 vehicles
Random Variables
A random variable assigns numerical values to random outcomes.
Discrete Random Variables
Examples:
- Number of defects
- Number of customers
Continuous Random Variables
Examples:
- Temperature
- Pressure
- Height
Probability Distributions
Probability distributions describe how values are distributed.
Normal Distribution 🔔
Most commonly used distribution.
Characteristics:
- Bell-shaped
- Symmetric
- Mean equals median
Applications:
- Manufacturing
- Measurement systems
- Signal processing
Binomial Distribution
Used when:
- Two outcomes exist
- Trials are independent
Examples:
- Pass/fail
- Success/failure
Poisson Distribution
Used for:
- Arrival rates
- Defect counts
- Traffic analysis
Central Limit Theorem ⭐
One of the most powerful results in statistics.
It states:
As sample size increases, the sampling distribution of the mean approaches a normal distribution regardless of the original population distribution.
Benefits:
- Simplifies analysis
- Supports confidence intervals
- Enables hypothesis testing
Mathematical Statistics in R 💻
R is specifically designed for statistical analysis.
Advantages include:
✅ Open source
✅ Large community
🚀 Thousands of packages
✅ Excellent visualization tools
✅ Strong mathematical capabilities
Installing R
Required software:
- R
- RStudio
Popular packages:
install.packages("ggplot2")
install.packages("dplyr")
install.packages("tidyr")
install.packages("caret")
Step-by-Step Statistical Analysis Using R 🔍
Step 1: Import Data
data <- read.csv("data.csv")Step 2: View Data
head(data)
summary(data)
Step 3: Calculate Descriptive Statistics
mean(data$salary)
median(data$salary)
sd(data$salary)
Outputs:
- Mean
- Median
- Standard deviation
Step 4: Create Visualizations
hist(data$salary)Histogram reveals:
- Shape
- Spread
- Outliers
Step 5: Test Hypotheses
t.test(data$salary)Used to determine whether observed differences are statistically significant.
Step 6: Build Regression Models
model <- lm(y ~ x)
summary(model)
Regression helps predict future outcomes.
Step 7: Interpret Results
Important metrics:
- P-value
- R-squared
- Confidence intervals
- Residual errors
Descriptive Statistics 📈
Descriptive statistics summarize data.
Measures of Central Tendency
| Measure | Meaning |
|---|---|
| Mean | Average |
| Median | Middle value |
| Mode | Most frequent value |
Measures of Dispersion
| Measure | Meaning |
|---|---|
| Variance | Spread of data |
| Standard Deviation | Typical deviation |
| Range | Maximum − Minimum |
R Example
mean(x)
median(x)
var(x)
sd(x)
range(x)
Inferential Statistics 🔬
Inferential statistics draws conclusions about populations using samples.
Parameter Estimation
Unknown population values are estimated using sample data.
Examples:
- Population mean
- Population variance
Confidence Intervals
A confidence interval provides a range likely to contain the true parameter.
Example:
95% Confidence Interval
t.test(x)$conf.intHypothesis Testing
General process:
Null Hypothesis
No effect exists.
Alternative Hypothesis
Effect exists.
Decision:
- Reject null hypothesis
- Fail to reject null hypothesis
Comparison of Major Statistical Methods ⚖️
| Method | Purpose | Example |
|---|---|---|
| Descriptive Statistics | Summarize data | Average salary |
| Hypothesis Testing | Compare groups | Drug effectiveness |
| Regression | Predict outcomes | House prices |
| ANOVA | Compare many groups | Product testing |
| Bayesian Statistics | Update beliefs | Risk assessment |
| Time Series Analysis | Forecast future values | Stock prices |
Important Statistical Formulas 📐
Mean
Variance
Standard Score
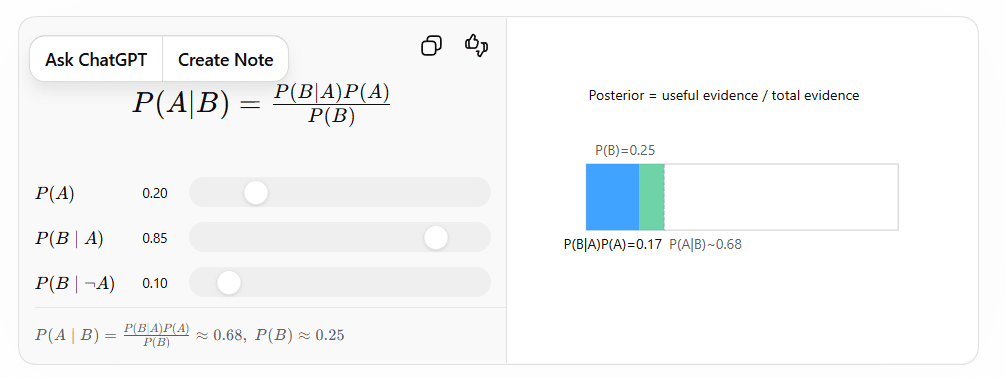
Bayes Theorem
Statistical Diagrams and Data Visualization 🎨
Visualization is essential for understanding data.
Common Statistical Charts
| Chart | Purpose |
|---|---|
| Histogram | Distribution |
| Box Plot | Outliers |
| Scatter Plot | Correlation |
| Line Graph | Trends |
| Bar Chart | Comparisons |
| Density Plot | Probability distribution |
R Histogram Example
hist(data$temperature)R Scatter Plot Example
plot(x, y)R Boxplot Example
boxplot(data$salary)Practical Examples 🏗️
Example 1: Manufacturing Quality Control
An engineer measures the diameter of 1,000 machine parts.
Objectives:
- Determine average diameter
- Estimate variability
- Identify defective products
R can quickly calculate:
mean(parts)
sd(parts)
Example 2: Traffic Engineering
Traffic sensors collect vehicle counts.
Statistics helps:
- Estimate peak demand
- Predict congestion
- Optimize signals
Example 3: Renewable Energy Systems
Wind turbine operators collect:
- Wind speed
- Power output
- Temperature
Statistical models predict future energy generation.
Real-World Applications 🌍
Mathematical statistics is used everywhere.
Civil Engineering
Applications:
- Structural reliability
- Material testing
- Traffic analysis
Mechanical Engineering
Applications:
- Failure prediction
- Reliability engineering
- Quality control
Electrical Engineering
Applications:
- Signal processing
- Communication systems
- Noise analysis
Chemical Engineering
Applications:
- Process optimization
- Reaction modeling
- Experimental design
Artificial Intelligence
Applications:
- Machine learning
- Pattern recognition
- Predictive analytics
Healthcare
Applications:
- Clinical trials
- Disease prediction
- Drug development
Finance
Applications:
- Risk management
- Portfolio optimization
- Fraud detection
Common Mistakes ❌
Ignoring Sample Size
Small samples often produce misleading conclusions.
Assuming Correlation Means Causation
Two variables moving together does not imply one causes the other.
Misinterpreting P-Values
A small p-value does not measure practical importance.
Using Wrong Statistical Tests
Different data types require different methods.
Ignoring Outliers
Extreme values can distort results significantly.
Overfitting Models
Complex models may perform poorly on new data.
Challenges and Solutions 🛠️
Challenge: Missing Data
Solution:
na.omit(data)Challenge: Non-Normal Data
Solution:
- Transform data
- Use nonparametric methods
Challenge: Large Datasets
Solution:
- Efficient packages
- Parallel computing
- Data sampling
Challenge: High Dimensionality
Solution:
- Principal Component Analysis
- Feature selection
Challenge: Computational Complexity
Solution:
- Cloud computing
- Optimized algorithms
Case Study 📖
Improving Manufacturing Yield Using R
A manufacturing company experienced a high defect rate.
Initial Situation
Monthly production:
- 50,000 units
- 6% defect rate
Management wanted to identify root causes.
Data Collection
Engineers gathered:
- Temperature
- Pressure
- Operator information
- Machine settings
Statistical Analysis
Using R:
model <- lm(defects ~ temperature + pressure)
summary(model)
Results revealed temperature as the primary contributor to defects.
Actions Taken
The company:
📊 Improved temperature controls
✅ Added sensors
✅ Automated monitoring
Final Results
After implementation:
| Metric | Before | After |
|---|---|---|
| Defect Rate | 6% | 1.5% |
| Productivity | 100% | 115% |
| Annual Savings | $0 | $1.2 Million |
This demonstrates how mathematical statistics transforms raw data into measurable business value.
Tips for Engineers 🎯
Learn Probability Thoroughly
Probability is the foundation of statistical reasoning.
Master R Programming
Practice:
- Data import
- Visualization
- Regression
- Simulation
Understand Assumptions
Every statistical method has assumptions.
Always verify them.
Visualize Before Modeling
Graphs often reveal patterns that numbers hide.
Focus on Interpretation
The goal is not just running calculations but understanding results.
Use Reproducible Workflows
Maintain scripts and documentation for future verification.
Combine Statistics and Domain Knowledge
Engineering expertise improves statistical decision-making.
Frequently Asked Questions (FAQs) ❓
What is mathematical statistics?
Mathematical statistics is the branch of mathematics that develops statistical methods using probability theory to analyze data and make decisions under uncertainty.
Why is R popular for statistics?
R provides advanced statistical functions, visualization tools, machine learning libraries, and a large open-source ecosystem.
Is mathematical statistics difficult to learn?
It can be challenging initially, but understanding probability, algebra, and basic programming greatly simplifies the learning process.
What industries use mathematical statistics?
Industries include engineering, healthcare, finance, manufacturing, transportation, artificial intelligence, and scientific research.
What is the difference between probability and statistics?
Probability predicts outcomes from known models, while statistics infers models and conclusions from observed data.
Is R better than Excel for statistical analysis?
For advanced analysis, large datasets, automation, and reproducibility, R is significantly more powerful than Excel.
Can R be used for machine learning?
Yes. R supports machine learning through packages such as caret, randomForest, xgboost, and many others.
How important is statistics in modern engineering?
Statistics is fundamental. Engineers use it daily for quality control, reliability assessment, optimization, forecasting, simulation, and decision-making.
Conclusion 🎓
Mathematical Statistics with Applications in R represents one of the most valuable skill sets in modern engineering, science, and data analytics. By combining the theoretical foundations of probability and statistical inference with the computational power of R, professionals can transform raw data into actionable insights.
From quality control in manufacturing and predictive maintenance in engineering systems to machine learning, healthcare analytics, and financial forecasting, statistical methods provide the tools needed to understand uncertainty and make informed decisions. R further enhances these capabilities through its extensive ecosystem of packages, visualization tools, and analytical functions.
For students, mastering mathematical statistics creates a strong foundation for advanced studies in data science, artificial intelligence, and engineering research. For professionals, it enables evidence-based decision-making, process optimization, and innovation in increasingly data-driven industries. As technology continues to evolve, expertise in mathematical statistics and R programming will remain an essential competitive advantage across the USA, UK, Canada, Australia, and Europe. 📊🚀📈


