Mathematical Foundations of Big Data Analytics: Essential Statistical, Algebraic, and Computational Principles for Modern Data Engineering 📊🚀
Introduction 🌍📈
Big Data Analytics has transformed the way organizations make decisions, optimize operations, and develop intelligent systems. From recommendation engines and autonomous vehicles to healthcare diagnostics and financial forecasting, modern analytics depends heavily on mathematics.
While software tools and programming frameworks often receive the most attention, the true engine behind data analytics is mathematics. Every prediction, classification, clustering operation, and optimization process relies on mathematical principles.
As data volumes continue to grow exponentially, engineers and data scientists require a solid understanding of mathematical foundations to build accurate, scalable, and reliable analytical systems.
Mathematics enables professionals to:
✅ Extract meaningful insights from massive datasets
✅ Develop predictive models
📚 Reduce uncertainty in decision-making
✅ Optimize computational performance
✅ Design intelligent machine learning systems
📚 Interpret analytical results correctly
Understanding these foundations helps both beginners and advanced engineers move beyond simply using tools and toward designing sophisticated analytical solutions.
Background Theory 📚🔬
The evolution of big data analytics is closely tied to developments in mathematics, statistics, and computer science.
Before modern computing, statisticians analyzed relatively small datasets manually. As computing power increased, organizations began collecting massive quantities of information from:
- Internet activity
- Mobile devices
- Industrial sensors
- Financial transactions
- Healthcare systems
- Social media platforms
- Smart cities
The emergence of Big Data introduced the famous “5 Vs”:
| Characteristic | Description |
|---|---|
| Volume | Massive amounts of data |
| Velocity | Rapid data generation |
| Variety | Multiple data formats |
| Veracity | Data quality and reliability |
| Value | Useful insights extracted |
Managing these characteristics requires mathematical models capable of handling uncertainty, complexity, and scalability.
Without mathematics, Big Data would simply be large collections of numbers with little practical value.
Technical Definition ⚙️
Big Data Analytics can be technically defined as:
The process of examining large, complex, and diverse datasets using mathematical, statistical, computational, and algorithmic techniques to discover patterns, relationships, trends, and actionable insights.
The mathematical foundation typically consists of:
- Statistics
- Probability Theory
- Linear Algebra
- Calculus
- Optimization Theory
- Information Theory
- Graph Theory
- Numerical Methods
These disciplines work together to enable advanced analytics and machine learning.
Core Mathematical Pillars of Big Data Analytics 🏗️
Statistics 📊
Statistics is the backbone of data analysis.
It provides methods to summarize, analyze, and interpret data.
Important concepts include:
Descriptive Statistics
Used to summarize datasets.
Common measures:
| Measure | Formula |
|---|---|
| Mean | Σx / n |
| Median | Middle value |
| Mode | Most frequent value |
| Range | Max − Min |
| Variance | Average squared deviation |
| Standard Deviation | √Variance |
These metrics help engineers understand data distribution.
Inferential Statistics
Inferential statistics allows conclusions about populations using sample data.
Examples include:
- Hypothesis testing
- Confidence intervals
- Regression analysis
- ANOVA
Applications:
📌 Quality control
📌 Manufacturing optimization
📚 Healthcare studies
📌 Market research
Probability Theory 🎲
Probability quantifies uncertainty.
In big data environments, uncertainty is unavoidable.
Probability helps answer questions such as:
- 📚 What is the likelihood of equipment failure?
- What is the chance a customer will make a purchase?
- What is the probability of network congestion?
Fundamental Probability Equation
P(A)=Favorable Outcomes/Total Outcomes
Probability forms the basis of:
- Machine learning
- Bayesian analytics
- Risk assessment
- Predictive modeling
Important Distributions
| Distribution | Application |
|---|---|
| Normal Distribution | Natural phenomena |
| Binomial Distribution | Success/failure events |
| Poisson Distribution | Event occurrence modeling |
| Exponential Distribution | Reliability engineering |
| Uniform Distribution | Random simulations |
Linear Algebra 🧮
Linear algebra is arguably the most important mathematical field in modern analytics.
Data is commonly represented as matrices and vectors.
Example matrix:
| User | Product A | Product B | Product C |
|---|---|---|---|
| U1 | 5 | 3 | 4 |
| U2 | 4 | 2 | 5 |
| U3 | 1 | 5 | 2 |
This structure enables machine learning algorithms to perform calculations efficiently.
Key Concepts
Vectors
Represent individual observations.
Example:
x = [2, 4, 6]
Matrices
Collections of vectors arranged in rows and columns.
Eigenvalues and Eigenvectors
Used extensively in:
- Principal Component Analysis (PCA)
- Data compression
- Feature extraction
Matrix Decomposition
Examples:
- Singular Value Decomposition (SVD)
- LU Decomposition
- QR Decomposition
These techniques help reduce computational complexity.
Calculus 📈
Calculus provides tools for understanding change and optimization.
Most machine learning algorithms use calculus during training.
Differentiation
Measures rates of change.
Example: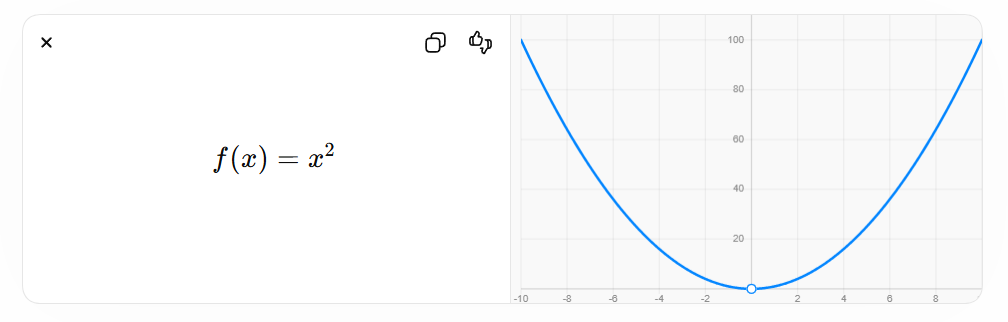
The derivative indicates how rapidly a function changes.
Applications include:
- Gradient descent
- Optimization
- Neural network training
Integration
Measures accumulation.
Applications:
- Probability density functions
- Signal processing
- Statistical modeling
Optimization Theory 🎯
Optimization seeks the best solution among many possibilities.
Big data systems frequently solve optimization problems.
Examples:
- Route optimization
- Resource allocation
- Recommendation systems
- Deep learning
Objective Function
A general optimization problem can be expressed as:
Minimize:
f(x)
Subject to:
g(x) ≤ 0
Optimization algorithms attempt to find optimal parameter values while respecting constraints.
Information Theory 📡
Information theory measures information content and uncertainty.
Developed by Claude Shannon.
Important concepts include:
Entropy
Measures uncertainty within data.
Higher entropy means greater unpredictability.
Applications:
- Feature selection
- Compression algorithms
- Decision trees
- Cybersecurity analytics
Mutual Information
Measures dependency between variables.
Used for:
- Feature engineering
- Pattern discovery
- Machine learning optimization
Graph Theory 🌐
Many real-world datasets naturally form networks.
Examples:
- Social media connections
- Transportation systems
- Supply chains
- Communication networks
Graph theory represents systems using:
| Component | Meaning |
|---|---|
| Nodes | Objects |
| Edges | Relationships |
Applications include:
- Fraud detection
- Network optimization
- Recommendation engines
- Community detection
Step-by-Step Explanation of Big Data Analytics Mathematics 🔄
Step 1: Data Collection
Sources:
- Sensors
- Databases
- APIs
- Web logs
Mathematics begins with understanding sampling techniques.
Step 2: Data Cleaning
Statistical methods identify:
- Missing values
- Outliers
- Inconsistencies
Methods include:
- Mean imputation
- Median replacement
- Standardization
Step 3: Data Transformation
Linear algebra transforms raw data into useful structures.
Examples:
- Matrix construction
- Feature encoding
- Dimensionality reduction
Step 4: Statistical Analysis
Engineers calculate:
- Means
- Variances
- Correlations
- Confidence intervals
This stage reveals underlying patterns.
Step 5: Model Development
Mathematical models are created using:
- Regression
- Classification
- Clustering
- Neural networks
Step 6: Optimization
Calculus and optimization adjust parameters.
Goal:
🎯 Minimize error
🎯 Maximize accuracy
Step 7: Interpretation
Statistical reasoning validates conclusions and avoids misleading insights.
Comparison of Major Mathematical Disciplines ⚖️
| Discipline | Main Purpose | Big Data Role |
|---|---|---|
| Statistics | Analyze data | Insight generation |
| Probability | Model uncertainty | Prediction |
| Linear Algebra | Handle matrices | Machine learning |
| Calculus | Measure change | Optimization |
| Graph Theory | Analyze networks | Relationship discovery |
| Information Theory | Quantify information | Feature engineering |
| Optimization | Improve solutions | Model training |
Diagrams and Conceptual Tables 📐
Mathematical Foundation Structure
Big Data Analytics
│
├── Statistics
│   ├── Descriptive
│   └── Inferential
│
├── Probability
│   ├── Distributions
│   └── Bayesian Models
│
├── Linear Algebra
│   ├── Vectors
│   ├── Matrices
│   └── Decomposition
│
├── Calculus
│   ├── Derivatives
│   └── Integrals
│
├── Optimization
│   └── Gradient Methods
│
└── Graph Theory
    └── Networks
Mathematical Workflow
Raw Data
    ↓
Statistics
    ↓
Probability Models
    ↓
Linear Algebra Processing
    ↓
Optimization
    ↓
Predictions
    ↓
Business Decisions
Examples 🔍
Example 1: Predicting Equipment Failure
Industrial sensors generate:
- Temperature data
- Pressure data
- Vibration data
Mathematics used:
🚀 Statistics
✅ Probability
✅ Regression Models
Result:
Predictive maintenance schedules.
Example 2: Recommendation Systems
Streaming platforms recommend content based on:
- Viewing history
- User ratings
- Similar users
Mathematics used:
🚀 Matrix factorization
✅ Linear algebra
✅ Optimization
Result:
Personalized recommendations.
Example 3: Fraud Detection
Banks analyze:
- Transaction frequency
- Geographic patterns
- Spending behavior
Mathematics used:
🚀 Probability theory
✅ Bayesian inference
✅ Statistical anomaly detection
Result:
Real-time fraud alerts.
Real World Applications 🌎
Healthcare 🏥
Applications:
- Disease prediction
- Medical imaging
- Drug discovery
Mathematics used:
- Statistics
- Machine learning
- Optimization
Manufacturing 🏭
Applications:
- Predictive maintenance
- Quality control
- Process optimization
Transportation 🚗
Applications:
- Route optimization
- Traffic prediction
- Autonomous vehicles
Finance 💰
Applications:
- Credit scoring
- Algorithmic trading
- Risk management
Telecommunications 📶
Applications:
- Network optimization
- Capacity planning
- Fault detection
Energy Systems ⚡
Applications:
- Smart grids
- Load forecasting
- Renewable energy optimization
Common Mistakes ❌
Ignoring Data Quality
Poor-quality data produces unreliable results.
Confusing Correlation with Causation
Two variables moving together does not imply one causes the other.
Overfitting Models
Models may memorize training data instead of learning patterns.
Misinterpreting Probability
Probability values are often misunderstood, leading to incorrect decisions.
Using Complex Models Unnecessarily
Sometimes simple statistical models outperform advanced machine learning systems.
Challenges and Solutions 🛠️
Challenge: Massive Data Volume
Problem:
Petabytes of information.
Solution:
🚀 Distributed computing
✅ Matrix optimization
✅ Parallel algorithms
Challenge: High Dimensionality
Problem:
Thousands of features.
Solution:
🚀 PCA
✅ Feature selection
✅ Dimensionality reduction
Challenge: Noise and Outliers
Problem:
Incorrect data points.
Solution:
🚀 Robust statistics
✅ Data preprocessing
✅ Outlier detection
Challenge: Computational Cost
Problem:
Long processing times.
Solution:
🚀 Numerical optimization
✅ Efficient algorithms
✅ Cloud computing
Case Study: Predictive Maintenance in Smart Manufacturing 🏭📊
A large manufacturing facility installed sensors on production equipment.
Collected data:
- Temperature
- Pressure
- Vibration
- Operating hours
Objective
Predict machine failures before breakdown occurs.
Mathematical Techniques Used
Statistics
Identified normal operating ranges.
Probability
Estimated failure likelihood.
Linear Algebra
Processed large sensor matrices.
Optimization
Improved predictive model accuracy.
Results
| Metric | Before | After |
|---|---|---|
| Downtime | 120 hrs/year | 45 hrs/year |
| Maintenance Cost | $500,000 | $290,000 |
| Production Efficiency | 82% | 94% |
Outcome:
📊 Significant cost savings
🚀 Improved reliability
🚀 Higher productivity
This case demonstrates how mathematical foundations directly impact engineering performance.
Tips for Engineers 💡
Build Strong Statistical Knowledge
Statistics remains the foundation of analytics.
Learn Linear Algebra Thoroughly
Most machine learning algorithms depend on matrix operations.
Understand Optimization
Optimization drives modern AI systems.
Focus on Interpretation
Mathematics is useful only when results can be translated into decisions.
Practice with Real Datasets
Theory becomes valuable when applied to practical engineering problems.
Master Probability
Uncertainty exists in every engineering system.
Develop Computational Thinking
Efficient mathematical implementation is as important as mathematical theory itself.
Frequently Asked Questions ❓
What mathematics is most important for big data analytics?
Statistics, probability, and linear algebra are generally considered the most critical foundations.
Why is linear algebra essential?
Data is represented as vectors and matrices, making linear algebra fundamental for machine learning and large-scale analytics.
Is calculus required for data science?
Yes. Optimization techniques used in machine learning heavily rely on derivatives and gradients.
How does probability help in analytics?
Probability models uncertainty and supports prediction, risk assessment, and decision-making.
What role does statistics play?
Statistics helps summarize data, identify patterns, test hypotheses, and validate conclusions.
Is graph theory important in big data?
Yes. Network analysis, social media analytics, fraud detection, and recommendation systems often rely on graph theory.
Can engineers work in big data without advanced mathematics?
Basic tasks are possible, but advanced analytics, AI development, and optimization require strong mathematical skills.
Which engineering fields use big data analytics?
Many fields including:
- Mechanical Engineering
- Electrical Engineering
- Civil Engineering
- Industrial Engineering
- Aerospace Engineering
- Biomedical Engineering
- Software Engineering
Conclusion 🎯
The mathematical foundations of Big Data Analytics form the intellectual framework behind modern data-driven engineering. Statistics provides methods for understanding data, probability quantifies uncertainty, linear algebra enables efficient data representation, calculus supports optimization, and graph theory uncovers complex relationships within networks.
As organizations continue generating unprecedented volumes of information, the importance of these mathematical disciplines will only increase. Engineers who master these foundations gain the ability to design smarter systems, develop accurate predictive models, optimize operations, and transform raw data into valuable insights.
Whether working in healthcare, manufacturing, finance, transportation, telecommunications, or artificial intelligence, a strong understanding of mathematics remains one of the most powerful tools for success in the era of Big Data. 📊🚀📈


