🛠️ Mathematical Statistics With Applications: Complete Engineering Guide to Statistical Analysis, Probability Models, and Real-World Decision Making 📊📈
Introduction 🚀
Mathematical Statistics is one of the most important disciplines connecting mathematics, engineering, science, economics, artificial intelligence, and industrial decision-making. It provides the theoretical framework that allows professionals to collect, analyze, interpret, and draw conclusions from data.
In today’s data-driven world, engineers and researchers rarely make decisions based on intuition alone. Instead, they rely on statistical methods to evaluate performance, predict future outcomes, optimize systems, and reduce uncertainty.
Whether designing a bridge, testing a new electronic component, evaluating manufacturing quality, developing machine learning algorithms, or analyzing medical research, mathematical statistics plays a central role in ensuring reliable conclusions.
📌 Mathematical statistics transforms raw observations into meaningful knowledge.
The field combines probability theory, mathematical modeling, inference techniques, and data analysis tools to help answer questions such as:
- What is the average performance of a system?
- How reliable is a manufacturing process?
- Is a new design better than an existing one?
- What is the probability of failure?
- How can future outcomes be predicted?
For engineering students and professionals across the USA, UK, Canada, Australia, and Europe, understanding mathematical statistics is essential for modern technical practice.
Background Theory 📚
Mathematical statistics evolved from probability theory, which originated in the study of gambling and chance events during the 17th century.
Several pioneers contributed to its development:
- Blaise Pascal
- Pierre de Fermat
- 📌 Jacob Bernoulli
- Thomas Bayes
- Carl Friedrich Gauss
- 📌 Ronald Fisher
- Karl Pearson
Their work established principles that now support:
✔ Engineering analysis
✔ Scientific research
📌 Financial modeling
✔ Artificial intelligence
✔ Quality control
📌 Reliability engineering
The relationship between probability and statistics can be summarized as:
Probability: Known model → Predict future observations.
Statistics: Observed data → Infer unknown model.
This distinction forms the foundation of modern statistical analysis.
Technical Definition ⚙️
Mathematical Statistics is the branch of mathematics that develops methods for collecting, organizing, analyzing, interpreting, and drawing conclusions from data using probability theory and mathematical models.
It includes:
| Area | Purpose |
|---|---|
| Descriptive Statistics | Summarize data |
| Probability Theory | Model uncertainty |
| Statistical Inference | Draw conclusions |
| Estimation Theory | Estimate unknown parameters |
| Hypothesis Testing | Validate assumptions |
| Regression Analysis | Predict relationships |
| Reliability Analysis | Assess system performance |
| Bayesian Statistics | Update beliefs with evidence |
Mathematical statistics provides rigorous methods for converting uncertainty into quantifiable information.
Background Concepts Every Engineer Should Know 🔍
Population
A population represents the complete set of observations under study.
Examples:
- All manufactured microchips
- All vehicles produced in a factory
- Every temperature measurement in a process
Sample
A sample is a subset selected from the population.
Example:
A quality engineer inspects:
n = 100 products
from a production batch of:
N = 50,000 products
Variable
A variable is a measurable characteristic.
Examples:
- Voltage
- Temperature
- Pressure
- Speed
- Weight
Parameter
A parameter describes a population.
Examples:
- Population mean (μ)
- Population variance (σ²)
Statistic
A statistic describes a sample.
Examples:
- Sample mean (x̄)
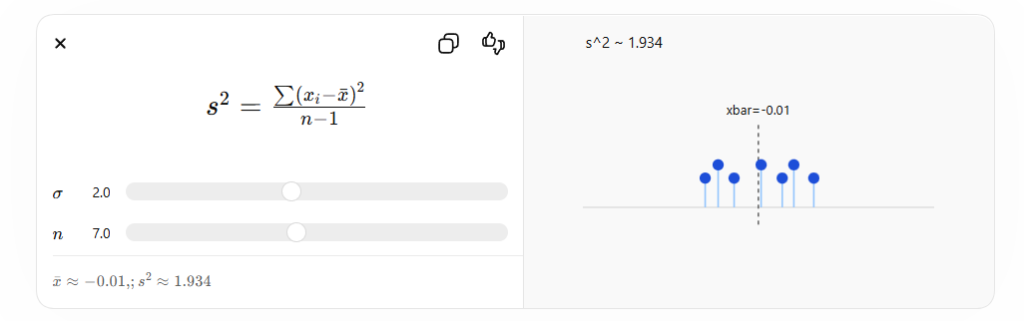
- Sample variance (s²)
Descriptive Statistics 📊
Descriptive statistics summarize and organize data.
Measures of Central Tendency
Mean
The arithmetic average.
xˉ=1n∑i=1nxi
Applications:
- Sensor measurements
- Production analysis
- Energy consumption studies
Median
The middle observation after sorting data.
Useful when data contains outliers.
Mode
The most frequently occurring value.
Often used in quality control and market research.
Measures of Dispersion
Range
Difference between maximum and minimum values.
Range = Maximum − Minimum
Variance
Measures spread around the mean.
Standard Deviation
The square root of variance.
A smaller standard deviation indicates greater consistency.
🛠️ Probability Theory Foundations 🎲
Probability is the backbone of mathematical statistics.
Probability Rules
For any event A:
0 ≤ P(A) ≤ 1
Where:
- 0 means impossible
- 1 means certain
Addition Rule
For mutually exclusive events:
P(A ∪ B) = P(A) + P(B)
Multiplication Rule
For independent events:
P(A ∩ B) = P(A)P(B)
Conditional Probability
Probability of A given B:
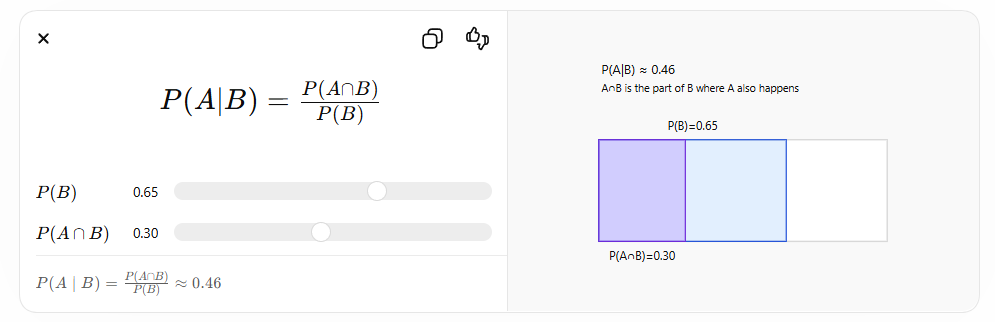
Applications include:
- Fault diagnosis
- Reliability assessment
- Machine learning
- Risk management
Probability Distributions 📈
Probability distributions describe how values are expected to occur.
Normal Distribution
The most important statistical distribution.
Characteristics:
🛠️ Bell-shaped curve
✔ Symmetric
✔ Mean = Median = Mode
Engineering Applications
- Manufacturing tolerances
- Measurement errors
- Sensor noise
- Process control
Binomial Distribution
Used when outcomes are:
- Success
- Failure
Examples:
- Defective products
- System pass/fail tests
- Component reliability
Poisson Distribution
Models rare events.
Examples:
- Machine failures
- Network interruptions
- Traffic incidents
Exponential Distribution
Used in reliability engineering.
Applications:
- Time between failures
- Equipment lifetime analysis
Statistical Inference 🔬
Statistical inference allows conclusions about populations using samples.
Why Sampling Matters
Studying an entire population is often:
🛠️ Expensive
❌ Time-consuming
❌ Impractical
Therefore, engineers rely on representative samples.
Types of Inference
Estimation
Estimate unknown parameters.
Hypothesis Testing
Determine whether evidence supports a claim.
Estimation Theory 🎯
Estimation determines unknown population parameters.
Point Estimation
Provides a single value estimate.
Example:
Average battery life = 8.4 hours
Interval Estimation
Provides a range.
Example:
95% Confidence Interval:
8.1 to 8.7 hours
Confidence Level
Common levels:
| Confidence Level | Reliability |
|---|---|
| 90% | Moderate |
| 95% | High |
| 99% | Very High |
Most engineering studies use 95%.
Hypothesis Testing Step by Step 🧪
Hypothesis testing evaluates claims using sample data.
Step 1: Define Hypotheses
Null Hypothesis:
H₀
Alternative Hypothesis:
H₁
Step 2: Select Significance Level
Common values:
α = 0.05
α = 0.01
Step 3: Collect Sample Data
Gather representative observations.
Step 4: Compute Test Statistic
Depending on the method:
- Z-test
- T-test
- Chi-square test
- F-test
Step 5: Make Decision
If p-value < α
Reject H₀
Otherwise:
Fail to reject H₀
Step-by-Step Statistical Analysis Workflow 🔄
Data Collection
Sources include:
- Experiments
- Sensors
- Surveys
- Databases
Data Cleaning
Remove:
- Missing values
- Errors
- Duplicates
Data Exploration
Calculate:
- Mean
- Median
- Variance
- Standard deviation
Model Selection
Choose appropriate statistical model.
Analysis
Apply:
- Regression
- Classification
- Estimation
- Hypothesis testing
Interpretation
Translate numerical results into practical conclusions.
Decision Making
Implement findings in real systems.
Regression Analysis 📉
Regression identifies relationships between variables.
Simple Linear Regression
Describes a straight-line relationship.
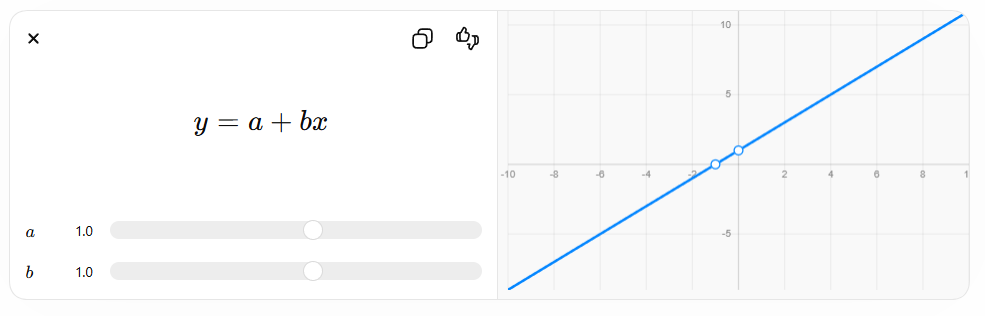
Where:
- y = dependent variable
- x = independent variable
- a = intercept
- b = slope
Engineering Example
Predict fuel consumption from vehicle speed.
Predict energy usage from production rate.
Multiple Regression
Uses multiple predictors simultaneously.
Applications:
- Machine learning
- Manufacturing optimization
- Environmental modeling
Comparison of Major Statistical Methods ⚖️
| Method | Main Purpose | Complexity | Engineering Usage |
|---|---|---|---|
| Mean Analysis | Average calculation | Low | High |
| Variance Analysis | Measure spread | Low | High |
| Regression | Prediction | Medium | Very High |
| Hypothesis Testing | Validation | Medium | Very High |
| Bayesian Analysis | Probability updating | High | Growing |
| Machine Learning Statistics | Advanced prediction | High | Very High |
| Reliability Statistics | Failure analysis | Medium | High |
Statistical Diagram Examples 📊
Histogram
Shows frequency distribution.
Example:
Frequency
|
|      ████
|    ███████
|  ██████████
|████████████
+----------------
    Data Values
Normal Distribution Curve
          /\
         /  \
       /      \
     /          \
----/------------\----
Box Plot
|----[====|====]----|Useful for identifying:
- Outliers
- Median
- Data spread
Practical Examples 🛠️
Example 1: Manufacturing Quality Control
A factory produces bolts.
Sample size:
n = 200
Defective bolts:
4
Estimated defect rate:
4 ÷ 200 = 2%
Management can use this information to improve production quality.
Example 2: Bridge Load Testing
Engineers record maximum load capacities.
Statistical analysis helps determine:
✔ Safety margins
✔ Reliability levels
🛠️ Structural consistency
Example 3: Network Performance
An internet provider measures latency.
Statistics reveal:
- Average response time
- Peak delays
- Reliability performance
Example 4: Renewable Energy Systems
Engineers analyze:
- Solar panel output
- Wind turbine production
- Seasonal variability
Statistical models improve forecasting accuracy.
Real-World Applications 🌍
Mathematical statistics appears in nearly every engineering field.
Mechanical Engineering
Applications:
- Fatigue analysis
- Quality control
- Reliability testing
Electrical Engineering
Applications:
- Signal processing
- Communication systems
- Noise reduction
Civil Engineering
Applications:
- Structural reliability
- Traffic analysis
- Environmental assessment
Aerospace Engineering
Applications:
- Flight testing
- Risk analysis
- Safety verification
Software Engineering
Applications:
- Machine learning
- Performance optimization
- User analytics
Biomedical Engineering
Applications:
- Clinical studies
- Medical device testing
- Health monitoring
Artificial Intelligence
Applications:
- Model training
- Pattern recognition
- Predictive analytics
Common Mistakes ❌
Using Small Samples
Small samples often produce misleading results.
Ignoring Outliers
Extreme values may distort conclusions.
Confusing Correlation and Causation
Two variables moving together does not imply one causes the other.
Violating Assumptions
Many statistical methods require:
- Independence
- Normality
- Random sampling
Misinterpreting P-values
A small p-value does not automatically imply practical importance.
Overfitting Models
Complex models may perform poorly on new data.
Challenges and Solutions ⚡
Challenge 1: Missing Data
Solution:
- Imputation methods
- Data reconstruction
Challenge 2: Noisy Measurements
Solution:
- Filtering techniques
- Larger sample sizes
Challenge 3: Non-Normal Data
Solution:
- Transformations
- Non-parametric methods
Challenge 4: Large Datasets
Solution:
- Cloud computing
- Parallel processing
Challenge 5: High Dimensionality
Solution:
- Feature selection
- Principal Component Analysis (PCA)
Case Study: Statistical Quality Control in Automotive Manufacturing 🚗
Project Overview
An automotive manufacturer experienced inconsistent engine component dimensions.
Objective
Reduce defect rate below:
1%
Data Collection
Engineers measured:
- Diameter
- Thickness
- Surface roughness
Sample size:
5,000 components
Statistical Analysis
Methods used:
- Histograms
- Control charts
- Process capability analysis
- Hypothesis testing
Findings
The primary variation originated from tool wear.
Corrective Action
✔ Improved maintenance schedule
🛠️ Automated inspection system
✔ Real-time monitoring
Results
| Metric | Before | After |
|---|---|---|
| Defect Rate | 4.2% | 0.8% |
| Rework Cost | High | Low |
| Customer Complaints | Frequent | Rare |
Impact
The company achieved:
- Better quality
- Lower costs
- Higher customer satisfaction
This case demonstrates how mathematical statistics directly improves engineering performance.
Tips for Engineers 💡
Understand the Data First
Never apply statistical methods blindly.
Visualize Everything
Graphs often reveal patterns hidden in tables.
Verify Assumptions
Check model requirements before analysis.
Focus on Practical Significance
Statistical significance alone is insufficient.
Automate Repetitive Tasks
Use tools such as:
- Python
- MATLAB
- R
- Excel
- Minitab
Document Every Step
Good documentation improves reproducibility.
Learn Probability Thoroughly
Strong probability knowledge simplifies advanced statistics.
Frequently Asked Questions ❓
What is Mathematical Statistics?
Mathematical Statistics is the branch of mathematics that develops statistical methods using probability theory to analyze data and make decisions under uncertainty.
Why is Mathematical Statistics important in engineering?
It helps engineers evaluate reliability, improve quality, predict outcomes, and optimize system performance.
What is the difference between probability and statistics?
Probability predicts outcomes from known models, while statistics infers models from observed data.
What is a confidence interval?
A confidence interval is a range of values likely to contain an unknown population parameter with a specified confidence level.
What is hypothesis testing?
Hypothesis testing is a formal procedure used to determine whether sample evidence supports or rejects a claim.
Which software is commonly used for statistical analysis?
Popular tools include Python, MATLAB, R, Excel, SAS, SPSS, and Minitab.
What distribution is most important in statistics?
The normal distribution is considered the most important because many natural and engineering phenomena approximately follow it.
Is mathematical statistics used in artificial intelligence?
Yes. Machine learning, predictive modeling, neural networks, and data analytics all rely heavily on statistical principles.
Conclusion 🎓
Mathematical Statistics is a cornerstone of modern engineering, science, and technology. By combining probability theory with rigorous analytical methods, it enables professionals to transform raw data into reliable knowledge. From quality control and reliability engineering to machine learning, artificial intelligence, healthcare, finance, and renewable energy systems, statistical techniques support informed decision-making in environments characterized by uncertainty.
Engineers who master mathematical statistics gain the ability to analyze complex systems, evaluate risks, validate designs, optimize performance, and develop innovative solutions backed by evidence rather than assumptions. As industries continue to generate enormous amounts of data, the importance of mathematical statistics will only increase, making it one of the most valuable skills for both students and experienced professionals in the twenty-first century. 📊🚀📈


