
Statistics 101: From Data Analysis and Predictive Modeling to Measuring Distribution and Determining Probability
Introduction 📊⚙️
Statistics is much more than tables, averages, and complicated formulas. In modern engineering, it is a practical decision-making framework that helps professionals understand measurements, detect patterns, evaluate uncertainty, compare alternatives, and make informed predictions.
Imagine an engineer monitoring the temperature of a manufacturing machine. The machine does not produce exactly the same temperature every minute. Another engineer measures concrete strength and obtains slightly different results from different samples. A data scientist analyzes thousands of customer records and tries to predict future behavior.
In all these situations, variation is unavoidable.
Statistics provides the language and tools needed to understand that variation.
From descriptive statistics to probability distributions and predictive modeling, statistical thinking connects raw observations with useful engineering decisions. The NIST/SEMATECH Engineering Statistics Handbook similarly emphasizes statistical methods for exploratory analysis, process characterization, modeling, improvement, monitoring, comparison, and reliability.



This guide introduces statistics from the ground up while gradually moving toward professional applications. Whether you are a university student, mechanical engineer, civil engineer, electrical engineer, software developer, or data professional, the goal is to develop statistical intuition rather than simply memorize formulas.
Background Theory 🔬
Why Engineers Need Statistics
Engineering systems operate in environments containing uncertainty.
Measurements can vary because of:
- Sensor accuracy
- Environmental conditions
- Material properties
- Manufacturing tolerances
- Human factors
- Sampling differences
- Equipment aging
- Random events
An engineer who ignores variation may interpret normal fluctuations as serious failures—or overlook genuine problems hidden inside noisy measurements.
Statistics transforms a collection of observations into meaningful information.
Descriptive and Inferential Statistics
Statistics can broadly be divided into two complementary areas.
Descriptive statistics summarizes observed data.
Examples include:
- Mean
- Median
- Mode
- Range
- Variance
- Standard deviation
- Percentiles
- Frequency distributions
Inferential statistics goes further. It uses a sample to make conclusions about a larger population.
For example, an engineer may test a limited number of manufactured components and use the results to understand the broader production process.
Statistics and Engineering Decisions
A statistical analysis normally follows a logical chain:
Observation → Data → Analysis → Pattern → Interpretation → Decision
This process is important because statistics does not automatically produce good decisions. The quality of the conclusion depends on the quality of the data, assumptions, sampling method, and interpretation.
Definition 📘
What Is Statistics?
Statistics is the systematic collection, organization, analysis, interpretation, and communication of data to support understanding and decision-making.
In engineering, statistics can be viewed as a bridge between measurements and decisions.
What Is Data?
Data represents recorded observations.
For example, a manufacturing engineer might collect:
- Product dimensions
- Temperature
- Pressure
- Production time
- Defect status
- Material strength
- Machine vibration
Data may be quantitative or qualitative.
Quantitative data represents numerical measurements, while qualitative data describes categories or characteristics.
What Is Probability?
Probability describes uncertainty about possible outcomes.
For example:
- The probability that a component fails during testing
- The probability that a sensor reading exceeds a threshold
- The probability that a randomly selected product is defective
Probability is fundamental to statistical modeling because real-world engineering systems rarely behave with complete certainty.
What Is a Distribution?
A probability distribution describes how possible values or outcomes are arranged.
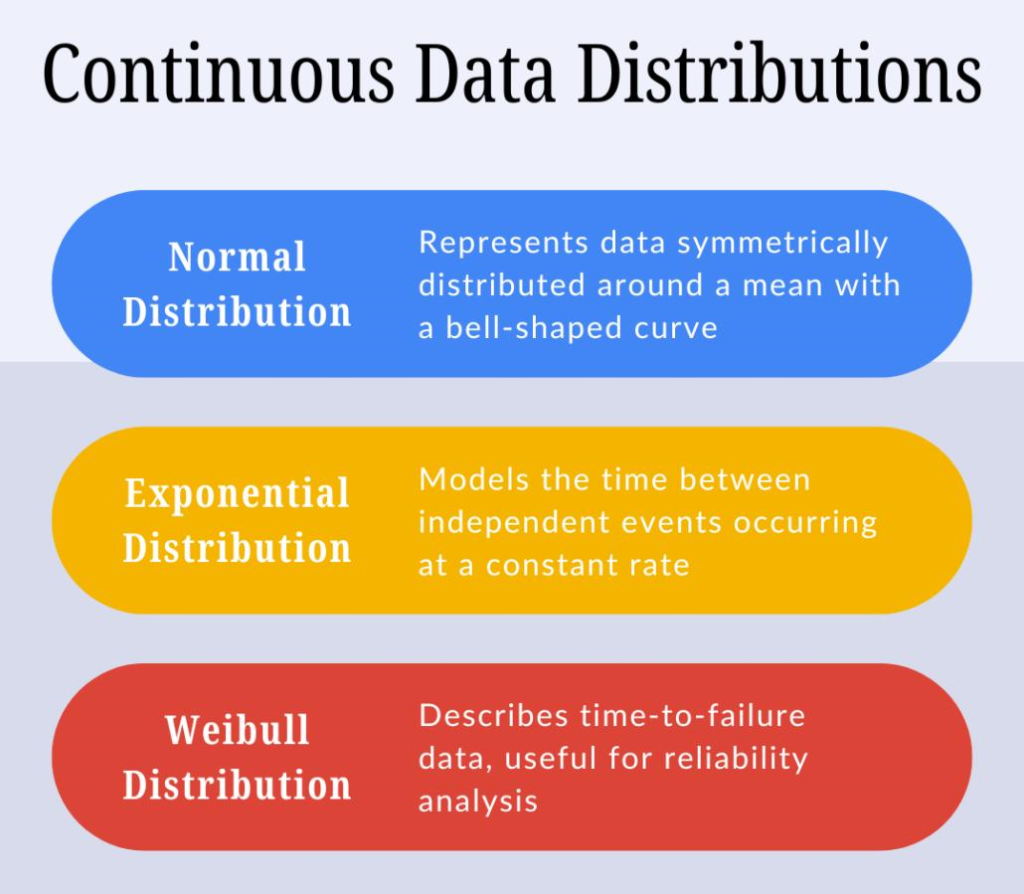
Common distributions include:
- Normal
- Uniform
- Binomial
- Poisson
- Exponential
- Weibull
- Lognormal
- Student’s t
NIST identifies probability distributions as fundamental statistical concepts and notes their applications in modeling data, confidence intervals, hypothesis testing, and simulation.
Step-by-Step Statistical Analysis 🔎
Step 1: Define the Engineering Question
Never begin by randomly calculating statistics.
Start with a question.
For example:
Why has the defect rate increased during the last month?
Or:
Which operating conditions are associated with higher machine temperatures?
A clear question determines what data should be collected.
Step 2: Collect the Data
Data may come from:
- Sensors
- Laboratory experiments
- Production records
- Surveys
- Databases
- Simulations
- Field measurements
Good data collection is critical.
Poorly collected data can produce misleading conclusions even when sophisticated statistical software is used.
Step 3: Clean the Data
Before analysis, inspect the dataset for:
- Missing values
- Duplicate records
- Impossible values
- Incorrect units
- Measurement errors
- Outliers
- Inconsistent categories
For example, mixing Celsius and Fahrenheit can create apparently strange measurements that are actually data-entry problems.
Step 4: Explore the Data
Create visualizations such as:
- Histograms
- Box plots
- Scatter plots
- Line charts
- Bar charts
- Control charts


Visualization often reveals patterns that are difficult to detect from a spreadsheet.
Step 5: Measure the Center
Central tendency describes where observations tend to concentrate.
The most common measures are:
Mean: the arithmetic average.
Median: the middle observation after sorting.
Mode: the most frequently occurring value.
The median can be particularly useful when extreme observations distort the mean.
Step 6: Measure the Spread
Two datasets can have the same average but dramatically different variability.
Important measures include:
- Range
- Variance
- Standard deviation
- Interquartile range
- Percentiles
Spread tells engineers how consistently a process behaves.
Step 7: Study the Distribution
Ask:
How are the observations arranged?
Are they:
- Symmetric?
- Skewed?
- Concentrated?
- Widely dispersed?
- Multi-modal?
- Heavy-tailed?
The answer affects which statistical techniques are appropriate.
Step 8: Investigate Relationships
Engineers frequently need to understand whether two variables are related.
For example:
Temperature ↔ Failure Rate
Pressure ↔ Flow Rate
Speed ↔ Energy Consumption
Material Composition ↔ Strength
Scatter plots and correlation analysis are useful starting points.
Step 9: Build a Model
Once relationships are understood, statistical models can help describe or predict outcomes.
Possible approaches include:
- Linear regression
- Logistic regression
- Time-series models
- Classification models
- Survival analysis
- Machine-learning models
Step 10: Validate the Result
A model should not simply be accepted because it produces predictions.
Check:
- Prediction accuracy
- Residual behavior
- Data leakage
- Generalization
- Assumptions
- Outliers
- Stability over time
A model that performs well on historical data but poorly on new data is not practically reliable.
Comparison: Major Statistical Concepts ⚖️
| Concept | Main Purpose | Typical Engineering Use |
|---|---|---|
| Mean | Measure central tendency | Average production measurement |
| Median | Find central position | Skewed measurements |
| Standard deviation | Measure variation | Process consistency |
| Histogram | View distribution | Quality analysis |
| Correlation | Examine association | Sensor relationships |
| Regression | Model relationships | Prediction |
| Probability | Quantify uncertainty | Risk assessment |
| Confidence interval | Describe parameter uncertainty | Engineering estimation |
| Hypothesis testing | Evaluate evidence | Process comparison |
| Time-series analysis | Study changes over time | Equipment monitoring |
Descriptive Statistics vs Predictive Modeling
Descriptive statistics asks:
What happened?
Predictive modeling asks:
What might happen next?
For example, an engineer may first summarize historical equipment temperatures and then develop a model to identify conditions associated with future overheating.
Both approaches are valuable.
Diagrams and Statistical Visualization 📈
The Statistical Thinking Pipeline
REAL-WORLD SYSTEM
       ↓
   DATA COLLECTION
       ↓
   DATA CLEANING
       ↓
 EXPLORATORY ANALYSIS
       ↓
 DISTRIBUTION + PATTERNS
       ↓
 STATISTICAL MODEL
       ↓
 VALIDATION
       ↓
 ENGINEERING DECISION
Distribution Concept
                 Frequency
                    ▲
                    │
              ▂▅████▅▂
            ▃██████████▃
          ▂██████████████▂
       ▂███████████████████▂
────────────────────────────────►
       Lower       Center       Higher
                  Values
This simplified visualization represents the general idea of a concentrated distribution. Actual engineering data may be symmetric, skewed, multi-modal, or follow other patterns.


NIST provides a broad gallery of probability distributions, including normal, uniform, t, F, chi-square, Weibull, lognormal, binomial, Poisson, and other distributions.
Examples 🛠️
Example 1: Manufacturing Dimensions
Suppose a factory produces metal shafts.
Engineers measure the diameter of hundreds of shafts.
The average diameter may look acceptable, but the histogram reveals that measurements are widely spread.
The conclusion is important:
The process may be centered correctly but insufficiently consistent.
The engineer might therefore investigate machine calibration, tooling wear, temperature, or material variability.
Example 2: Bridge Monitoring
Sensors installed on a bridge continuously record vibration.
Most measurements remain within the historical pattern, but a new cluster of unusual observations appears.
Statistical analysis can help determine whether this is:
- Normal environmental variation
- Sensor malfunction
- A temporary event
- A developing structural issue
Statistics does not replace engineering judgment, but it helps identify where attention is required.
Example 3: Predictive Maintenance
A company records:
- Motor temperature
- Vibration
- Operating hours
- Load
- Maintenance history
- Failure events
A predictive model can learn patterns associated with failures.
Instead of waiting for equipment to break, engineers can prioritize inspections based on estimated risk.
Real-World Applications 🌍
Manufacturing
Statistics supports:
- Quality control
- Process optimization
- Defect detection
- Tolerance analysis
- Reliability engineering
- Experimental design
Civil Engineering
Applications include:
- Concrete strength analysis
- Structural monitoring
- Soil characterization
- Traffic analysis
- Construction quality control
- Infrastructure reliability
Mechanical Engineering
Mechanical engineers use statistics for:
- Fatigue analysis
- Reliability
- Thermal measurements
- Vibration analysis
- Manufacturing processes
- Predictive maintenance
Electrical Engineering
Applications include:
- Signal analysis
- Sensor validation
- Communication systems
- Power-system monitoring
- Failure prediction
- Experimental testing
Software and Data Science
Statistics forms the foundation of:
- A/B testing
- Machine learning
- Forecasting
- Classification
- Recommendation systems
- Anomaly detection
- Experiment analysis
Common Mistakes ⚠️
Confusing Correlation With Causation
Two variables may move together without one causing the other.
For example, machine temperature and production volume may increase simultaneously because both are influenced by operating intensity.
Ignoring Data Quality
A sophisticated model cannot rescue fundamentally incorrect measurements.
Garbage in → garbage out.
Overusing the Mean
Averages can hide important information.
Two production lines can have identical averages while having very different variability.
Ignoring Outliers
An outlier may be:
- A measurement error
- A data-entry problem
- A legitimate rare event
- Evidence of a new failure mechanism
Never automatically delete it.
Assuming Every Dataset Is Normally Distributed
The normal distribution is important, but it is not universal.
NIST specifically emphasizes checking whether distributional assumptions are justified before relying on techniques based on those assumptions.
Confusing Statistical Significance With Engineering Importance
A tiny effect can become statistically detectable with a very large dataset.
That does not necessarily mean the effect is practically important.
Challenges & Solutions 🚧
| Challenge | Practical Solution |
|---|---|
| Missing data | Investigate why values are missing |
| Outliers | Examine their origin before removing |
| Small sample | Collect more representative observations |
| Noisy measurements | Improve measurement procedures |
| Non-normal data | Consider appropriate transformations or distributions |
| Overfitting | Validate models using unseen data |
| Biased sampling | Improve sampling design |
| Confusing correlation and causation | Use experiments or causal analysis |
| Changing processes | Monitor performance over time |
| Too many variables | Use feature selection and domain knowledge |
Case Study: Predicting Manufacturing Defects 🏭
The Problem
A manufacturing company notices that its defect rate has increased.
Management wants to know why.
Data Collection
Engineers collect information about:
- Machine identification
- Production shift
- Temperature
- Pressure
- Material batch
- Operator
- Production speed
- Defect status
Exploratory Analysis
The first analysis shows that defects are not distributed evenly across all operating conditions.
Some machines appear to produce more defective components.
However, this observation alone does not prove that the machines are responsible.
Deeper Investigation
Engineers compare machine behavior with:
- Maintenance history
- Operating temperature
- Material batches
- Production schedules
They discover that the apparent machine effect is strongly connected to operating conditions.
Predictive Modeling
A classification model is developed to estimate the probability that a production unit will become defective.
The model is tested on data that was not used during training.
Engineering Decision
The company uses the model as an early-warning tool rather than an automatic decision-maker.
High-risk production runs receive additional inspection.
Result
The statistical workflow provides more value than simply calculating the average defect rate.
It connects:
Data → Patterns → Risk → Prediction → Action
That is the real power of applied statistics.
Essential Tips for Learning Statistics 🎯
Start With Data, Not Formulas
Understand what a dataset represents before learning complicated mathematical notation.
Master the Core Concepts
Focus on:
- Mean
- Median
- Variation
- Probability
- Distributions
- Sampling
- Correlation
- Regression
- Confidence intervals
- Hypothesis testing
Learn Visualization
A good graph can reveal a problem before a statistical test does.
Understand Distributions
Do not simply memorize distribution names.
Learn when and why different distributions appear.
Connect Statistics to Engineering
Whenever learning a statistical technique, ask:
What engineering problem could this solve?
That question transforms abstract theory into practical knowledge.
Use Software as a Tool
Python, R, MATLAB, Excel, and specialized statistical packages can perform calculations quickly.
But software should support statistical reasoning—not replace it.
Think About Uncertainty
A statistical result is rarely a perfect representation of reality.
Always ask:
How certain is this conclusion?
What assumptions were made?
What could make the conclusion wrong?
Study Real Datasets
Working with imperfect real-world datasets teaches more than repeatedly analyzing clean textbook examples.
NIST’s engineering statistics resources include statistical techniques, case studies, datasets, software resources, and probability-distribution materials intended to help scientists and engineers apply statistics.
FAQs ❓
What is statistics in simple terms?
Statistics is the science of learning from data. It helps us summarize observations, identify patterns, measure uncertainty, compare alternatives, and make informed predictions.
Why is statistics important in engineering?
Engineering systems contain variability and uncertainty. Statistics helps engineers understand that variability, evaluate reliability, monitor processes, analyze experiments, and make better decisions.
What is the difference between probability and statistics?
Probability generally starts with assumptions about possible outcomes and examines uncertainty. Statistics generally starts with observed data and uses that information to understand a population or process.
What is a probability distribution?
A probability distribution describes how possible values or outcomes are arranged and how likely different outcomes are. Different distributions are useful for different types of engineering data.
Is the normal distribution always required?
No. Many datasets do not follow a normal distribution. Engineers should examine their data and select statistical methods whose assumptions are appropriate for the problem.
What is predictive modeling?
Predictive modeling uses historical information to estimate future or unknown outcomes. Examples include predicting equipment failure, product defects, energy consumption, or customer behavior.
Should engineers learn Python for statistics?
Python is extremely useful because it combines statistical analysis, visualization, data processing, automation, and machine learning in one ecosystem. However, statistical concepts are more important than any specific programming language.
Can statistics replace engineering judgment?
No. Statistics provides evidence and quantitative insight, but engineers must interpret results using domain knowledge, physical principles, safety requirements, and practical constraints.
Conclusion 🚀
Statistics is one of the most powerful foundations for modern engineering and data-driven decision-making.
It begins with something simple: observations.
From there, engineers can organize data, visualize distributions, measure variation, evaluate probability, investigate relationships, construct predictive models, and quantify uncertainty.
The most important lesson is that statistics is not simply about calculating averages or memorizing probability distributions.
It is about thinking correctly when reality contains variation and uncertainty.
A successful statistical workflow therefore looks like:
Ask the right question → collect reliable data → explore the evidence → understand variation → select an appropriate statistical method → validate the result → communicate uncertainty → make an engineering decision.
For beginners, mastering these foundations creates a strong pathway toward data science, machine learning, reliability engineering, quality control, and predictive analytics. For professionals, statistical thinking provides a disciplined way to turn complex measurements into actionable engineering intelligence.
And that is why statistics remains essential across manufacturing, civil engineering, mechanical systems, electronics, software, artificial intelligence, and virtually every modern technical discipline. 📊⚙️🚀
NIST’s engineering statistics framework similarly positions statistical methods as tools for scientists and engineers to design experiments, analyze processes, evaluate results, and understand statistical conclusions in practical engineering contexts.




