
Statistical Methods for Machine Learning: Discover How to Transform Data into Knowledge with Python
Introduction
Machine learning is often presented as a collection of algorithms that can predict outcomes, classify information, or discover hidden patterns. However, beneath many successful machine learning systems lies a powerful foundation: statistics. 📊🤖
Statistics provides the language and tools needed to understand data before a machine learning model attempts to learn from it. It helps engineers and data scientists determine whether a pattern is meaningful, whether a dataset is biased, whether variables are related, and whether a model is producing reliable predictions.
Python makes statistical analysis particularly accessible because it combines a simple programming environment with an extensive ecosystem of scientific libraries. Tools such as NumPy, pandas, SciPy, Matplotlib, and scikit-learn allow beginners to move from raw data to statistical investigation and eventually to machine learning.


A useful way to think about the relationship is:
Raw Data → Statistics → Knowledge → Machine Learning → Prediction → Decision 🔄
For engineering students and professionals, this connection is especially important. A model can produce impressive predictions while still being statistically inappropriate. Understanding statistical methods helps prevent that problem.

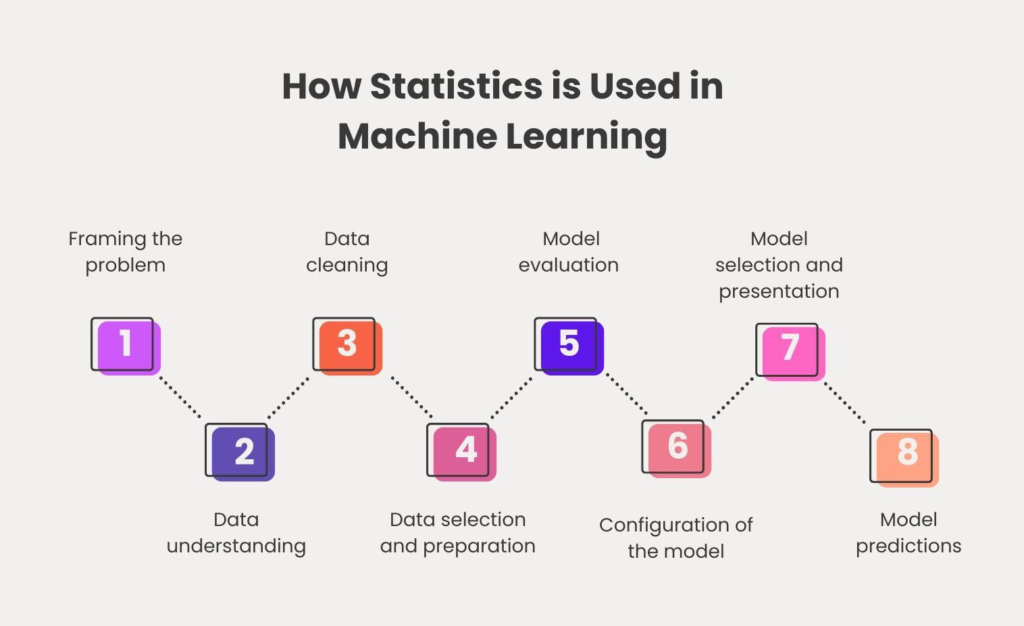

Background Theory
Why statistics matters in machine learning
Statistics is concerned with collecting, organizing, analyzing, interpreting, and communicating information from data. Machine learning extends these ideas by creating computational systems capable of learning patterns from examples.
Consider an engineering dataset containing measurements from machines in a factory. The dataset might include:
- Temperature
- Vibration
- Pressure
- Operating speed
- Energy consumption
- Maintenance history
- Failure status
Simply feeding these variables into an algorithm does not guarantee useful results.
Statistical analysis can reveal whether temperature is associated with failures, whether vibration measurements contain unusual observations, whether some variables are strongly related, and whether the dataset contains enough representative examples.
Descriptive and inferential thinking
Statistical methods can broadly be divided into two important forms of thinking.
Descriptive statistics summarizes what is already present in the dataset. Examples include averages, medians, ranges, distributions, and variability.
Inferential statistics attempts to make conclusions about a broader population using available observations. This includes confidence intervals, hypothesis testing, statistical estimation, and probability-based reasoning.
Machine learning frequently combines both perspectives.
Probability as a foundation
Probability provides a framework for dealing with uncertainty. Machine learning predictions are rarely absolutely certain. Instead, a model may estimate how likely different outcomes are.
For example, an industrial predictive-maintenance system might classify a machine as having a high probability of failure within a future operating period.
This probabilistic perspective becomes essential when engineers must make decisions under uncertainty. ⚙️📈
Definition
Statistical methods for machine learning are techniques derived from statistics that help professionals understand datasets, identify relationships, quantify uncertainty, evaluate hypotheses, select useful variables, construct predictive models, and assess model reliability.
In Python, these methods can be implemented using libraries such as:
| Python Library | Typical Purpose |
|---|---|
| NumPy | Numerical operations and arrays |
| pandas | Data manipulation and exploration |
| SciPy | Scientific and statistical analysis |
| Matplotlib | Data visualization |
| Seaborn | Statistical visualization |
| scikit-learn | Machine learning and model evaluation |
| statsmodels | Statistical modeling and inference |
The important principle is that statistics should not be treated as a separate subject from machine learning. It is part of the reasoning process that makes machine learning more trustworthy.
Step-by-Step Statistical Workflow with Python
Step 1: Understand the dataset
Before building a model, inspect the structure of the data.
Python and pandas can help determine:
- Number of observations
- Number of variables
- Data types
- Missing values
- Duplicate records
- Potential outliers
- Categorical variables
- Numerical variables
A beginner should resist the temptation to immediately train a model.
The first question should be:
“What does this data actually represent?” 🔍
Step 2: Perform descriptive analysis
The next stage is to summarize the dataset.
Useful statistical concepts include:
- Mean
- Median
- Mode
- Minimum
- Maximum
- Range
- Variance
- Standard deviation
- Percentiles
- Frequency distributions
These measurements provide an initial picture of the data.
For example, if the average machine temperature appears normal but the maximum temperature is extremely high, engineers should investigate whether those observations represent genuine operating conditions or measurement problems.
Step 3: Visualize distributions
Statistics becomes easier to understand when numerical summaries are combined with visualization.


Common visualizations include:
- Histograms
- Box plots
- Scatter plots
- Density plots
- Bar charts
- Correlation heatmaps
A histogram can reveal whether values are concentrated around a particular region or distributed across a broad range.
A box plot can highlight unusually large or small observations.
A scatter plot can show whether two variables appear to move together.
Step 4: Investigate relationships
Machine learning depends heavily on relationships between variables.
Correlation analysis can help identify variables that appear to move together. However, correlation should not automatically be interpreted as causation. ⚠️
For example, two engineering measurements may have a strong relationship because both are influenced by a third variable.
This distinction is extremely important when designing predictive systems.
Step 5: Handle missing and unusual data
Real-world datasets are rarely perfect.
Missing observations may occur because of:
- Sensor failures
- Manual entry errors
- Network interruptions
- Incomplete surveys
- Database problems
Statistical analysis can help determine whether missing values should be removed, replaced, or investigated separately.
Outliers require similar care. An unusual observation may be an error—or it may represent an important rare event.
Step 6: Prepare the data
Statistical understanding helps guide preprocessing.
Typical operations include:
- Scaling numerical features
- Encoding categorical variables
- Removing duplicate records
- Handling missing values
- Selecting relevant features
- Splitting datasets into training and testing portions
Good preprocessing improves both model performance and interpretability.
Step 7: Build and evaluate a model
After statistical exploration, machine learning algorithms can be trained.
Depending on the problem, engineers may use:
- Linear regression
- Logistic regression
- Decision trees
- Random forests
- Support vector machines
- Gradient boosting
- Neural networks
Evaluation should use appropriate statistical and machine learning metrics.
Examples include accuracy, precision, recall, F1-score, mean absolute error, and root mean squared error.
Step 8: Interpret the results
The final stage is not simply obtaining a prediction.
Engineers should ask:
Why did the model produce this result?
A statistically informed analysis considers uncertainty, data quality, sampling limitations, possible bias, and whether the model generalizes to new observations.
Comparison: Statistics vs Machine Learning
| Aspect | Statistical Analysis | Machine Learning |
|---|---|---|
| Primary focus | Understanding data and relationships | Prediction and pattern learning |
| Typical question | What relationships exist? | What will happen next? |
| Interpretability | Often high | Varies by model |
| Data requirements | Can work with smaller datasets | Often benefits from larger datasets |
| Uncertainty analysis | Central | Important but varies |
| Prediction | Possible | Usually a major objective |
| Feature relationships | Explicitly analyzed | Often learned automatically |
| Model complexity | Frequently controlled | Can become highly complex |
Neither approach should automatically be considered superior.
In many engineering applications, the best solution combines both. Statistics can explain the dataset, while machine learning can exploit complex relationships for prediction. 🧠⚙️
Diagrams and Statistical Concepts
A simplified machine learning pipeline can be represented as:
              ┌───────────────┐
              │   Raw Data    │
              └───────┬───────┘
                      ↓
             ┌────────────────┐
             │ Data Cleaning   │
             └───────┬────────┘
                     ↓
          ┌─────────────────────┐
          │ Statistical Analysis│
          └──────────┬──────────┘
                     ↓
             ┌──────────────┐
             │ Visualization│
             └──────┬───────┘
                    ↓
             ┌─────────────┐
             │ ML Modeling │
             └──────┬──────┘
                    ↓
          ┌──────────────────┐
          │ Model Evaluation │
          └────────┬─────────┘
                   ↓
             ┌───────────┐
             │ Decision  │
             └───────────┘
Important statistical methods
| Method | What it helps investigate |
|---|---|
| Mean and median | Central tendency |
| Standard deviation | Data variability |
| Percentiles | Position within a distribution |
| Correlation | Association between variables |
| Hypothesis testing | Evidence for or against assumptions |
| Confidence intervals | Uncertainty around estimates |
| Regression | Relationships and prediction |
| Probability distributions | Behavior of random variables |
| Sampling | Representing larger populations |
| Cross-validation | Model generalization |


Examples
Example 1: Predicting equipment failure
Suppose an engineering company collects vibration and temperature readings from industrial motors.
Statistical analysis reveals that machines approaching failure often show unusual vibration patterns.
A machine learning model can then learn from historical examples and identify motors that may require inspection.
The statistical stage helps engineers understand the data, while machine learning automates prediction.
Example 2: Customer churn
A software company wants to identify customers who may cancel their subscriptions.
The dataset could contain:
- Login frequency
- Subscription duration
- Support requests
- Product usage
- Payment history
Statistical analysis can reveal which variables appear associated with churn. A classification model can subsequently estimate which current customers are at higher risk.
Example 3: Quality control
A manufacturing company records product measurements from a production line.
Statistical monitoring can identify unusual production behavior. Machine learning can go further by learning complex combinations of measurements associated with defective products.
Real-World Applications
Engineering and manufacturing
Statistical machine learning can support predictive maintenance, quality control, process optimization, and anomaly detection.
Healthcare technology
Statistical models and machine learning can assist with risk prediction, medical-image analysis, and patient-data research. Because healthcare involves sensitive decisions, validation and uncertainty assessment are particularly important.
Finance
Banks and financial institutions use statistical and machine learning techniques for fraud detection, credit-risk assessment, forecasting, and customer analysis.
Energy systems
Power and renewable-energy companies can analyze historical measurements to improve demand forecasting, equipment monitoring, and energy management. ⚡
Transportation
Machine learning systems can analyze vehicle and traffic data for maintenance planning, route optimization, demand forecasting, and safety-related applications.
Common Mistakes
Ignoring data quality
A sophisticated algorithm cannot compensate for fundamentally unreliable data.
Confusing correlation with causation
A strong statistical relationship does not automatically prove that one variable causes another.
Data leakage
Data leakage occurs when information unavailable at prediction time accidentally enters the training process.
This can make a model appear extremely accurate during testing while performing poorly in production.
Overfitting
A model can memorize patterns specific to its training data instead of learning relationships that generalize.
Choosing metrics incorrectly
Accuracy may be misleading when classes are highly imbalanced. Engineers should select metrics appropriate to the actual problem.
Ignoring uncertainty
A prediction should not automatically be treated as a guaranteed outcome.
Challenges and Solutions
| Challenge | Practical Solution |
|---|---|
| Missing data | Investigate the cause and use appropriate treatment |
| Outliers | Determine whether they are errors or genuine events |
| Imbalanced classes | Use suitable metrics and sampling strategies |
| Overfitting | Use validation, regularization, and simpler models where appropriate |
| High-dimensional data | Apply feature selection or dimensionality reduction |
| Data bias | Examine sampling and collection procedures |
| Poor interpretability | Use explainable models and interpretation techniques |
| Changing production data | Monitor model performance continuously |
One of the biggest challenges is distribution shift. A model trained on historical data may encounter a different environment after deployment.
For example, a predictive-maintenance model developed using older machines may perform differently after a company introduces a new generation of equipment.
Case Study: Predictive Maintenance for Industrial Machines
Imagine a manufacturing facility operating hundreds of motors.
Historically, maintenance teams inspected equipment according to fixed schedules. However, some machines failed before their scheduled inspection while others were inspected even though they remained healthy.
The company begins collecting sensor information.
Data collection
Sensors record:
- Temperature
- Vibration
- Operating hours
- Rotational speed
- Load
- Maintenance events
Statistical investigation
Engineers analyze historical observations and discover that certain combinations of sensor behavior frequently occur before failures.
They visualize distributions, inspect unusual observations, examine relationships, and investigate missing readings.
Machine learning stage
The cleaned dataset is used to train a predictive model.
The model learns patterns associated with previous failures and evaluates its performance on previously unseen observations.
Deployment
The system assigns risk levels to machines.
Instead of replacing equipment simply because it has operated for a certain number of hours, maintenance teams can prioritize machines showing statistically meaningful warning patterns.
Result
The combination of statistics and machine learning creates a more informed maintenance strategy.
The important lesson is that the algorithm is only one component of the solution. Data quality, statistical reasoning, engineering knowledge, and continuous monitoring are equally important.
Essential Tips
For beginners
Start with descriptive statistics before studying complex machine learning algorithms.
Learn how to use pandas for data exploration and Matplotlib or Seaborn for visualization.
Practice interpreting distributions rather than simply generating charts.
For advanced learners
Study probability distributions, statistical inference, regression, experimental design, Bayesian reasoning, sampling theory, and model validation.
Learn to distinguish predictive performance from statistical significance.
For engineering professionals
Always connect statistical findings with physical system knowledge.
A mathematically strong relationship may not make engineering sense.
For Python developers
Build a repeatable workflow:
Load → Inspect → Clean → Explore → Visualize → Model → Validate → Interpret → Monitor
Keep preprocessing reproducible and document assumptions.
For machine learning projects
Never rely on a single performance measurement.
Compare multiple metrics, inspect errors, validate against realistic data, and evaluate whether the model remains useful after deployment.
FAQs
Why are statistical methods important in machine learning?
They help professionals understand data, quantify variability, identify relationships, evaluate assumptions, measure uncertainty, and assess whether machine learning results are reliable.
Do I need advanced mathematics to learn statistics for machine learning?
Not initially. Beginners can start with descriptive statistics, probability concepts, distributions, correlation, visualization, and practical Python exercises. More advanced mathematical knowledge becomes valuable as models become more sophisticated.
Which Python libraries are useful for statistical analysis?
NumPy, pandas, SciPy, Matplotlib, Seaborn, statsmodels, and scikit-learn form a powerful ecosystem for statistical analysis and machine learning.
Is statistics more important than machine learning algorithms?
They serve different purposes. A powerful algorithm trained on poorly understood or biased data can produce unreliable results. Statistical reasoning helps create a stronger foundation for machine learning.
What is the difference between correlation and causation?
Correlation means variables are statistically associated. Causation means changing one factor produces a change in another under appropriate conditions. Correlation alone does not establish causation.
Can statistics help prevent overfitting?
Yes. Statistical thinking supports proper sampling, validation, model comparison, feature selection, and evaluation on unseen data, all of which help identify overfitting.
What should I learn first in Python?
Start with Python fundamentals, then learn NumPy and pandas. After that, develop skills in visualization and statistical analysis before moving deeply into scikit-learn and advanced machine learning.
Are statistical methods useful outside machine learning?
Absolutely. Statistics is widely used in engineering, scientific research, manufacturing, finance, business analytics, healthcare, quality control, experimentation, and many other fields.
Conclusion
Statistical methods provide one of the most important foundations for practical machine learning. They allow engineers and data scientists to move beyond simply training algorithms and instead develop a deeper understanding of what the data means, which patterns matter, and how much confidence should be placed in a prediction. 📊🧠
Python makes this process highly accessible. With pandas, NumPy, SciPy, visualization libraries, and scikit-learn, learners can build a complete workflow from raw observations to statistical analysis and machine learning prediction.
The most effective approach is not “statistics versus machine learning.” It is:
Statistics + Engineering Knowledge + Python + Machine Learning = Better Data-Driven Decisions 🚀
For students, mastering these concepts creates a strong foundation for data science and artificial intelligence. For professionals, statistical thinking can improve the reliability, interpretability, and practical value of machine learning systems.
Ultimately, machine learning transforms data into predictions—but statistics helps transform data into trustworthy knowledge.




