
Python for Data Science Cheat Sheet: Essential Guide for Beginners and Professionals


Introduction
🐍 Python for Data Science has become one of the most useful technical skills for students, engineers, analysts, researchers, and technology professionals. Its popularity comes from a combination of readable syntax, a huge ecosystem of libraries, strong community support, and the ability to move from raw data to useful insights quickly.
Data science normally involves several stages: collecting data, cleaning it, exploring patterns, visualizing results, building predictive models, and communicating conclusions. Python can support almost every stage of this workflow.
A Python for Data Science Cheat Sheet is therefore more than a list of commands. It is a compact reference for remembering the most important programming concepts and knowing which tool to use for a particular data problem.


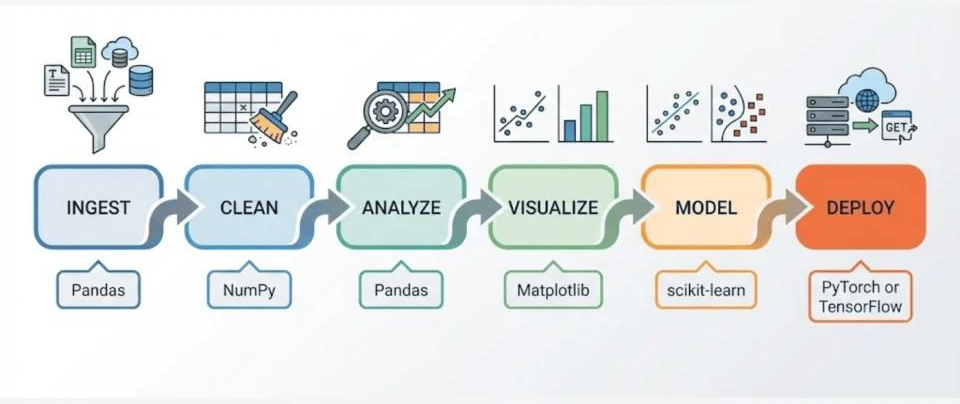


Whether you are learning data science for university, engineering research, business analytics, or professional development, understanding the relationship between Python and its major libraries can dramatically improve your productivity.
This guide provides a practical reference covering Python fundamentals, NumPy, Pandas, data visualization, data preparation, machine learning concepts, common mistakes, real-world applications, and professional tips.
Background Theory
Why Python Is Important in Data Science
Python is a general-purpose programming language, but its flexibility makes it particularly effective for data-oriented work.
A typical data science environment may contain:
- 🐍 Python for programming
- 🔢 NumPy for numerical operations
- 🐼 Pandas for tabular data
- 📊 Matplotlib for visualization
- 🎨 Seaborn for statistical graphics
- 🤖 Scikit-learn for machine learning
- 🧠 TensorFlow or PyTorch for deep learning
- 📓 Jupyter for interactive experimentation
The important idea is that these tools complement each other rather than competing with one another.
The Data Science Workflow
A practical Python data science workflow can be viewed as:
Data Collection → Data Cleaning → Exploration → Visualization → Feature Preparation → Modeling → Evaluation → Communication
Each stage may require different Python libraries.
For example, Pandas can organize a dataset, NumPy can perform numerical operations, Matplotlib can visualize trends, and Scikit-learn can create a machine-learning model.
Python Environments
Professionals commonly work with environments such as:
- Jupyter Notebook
- JupyterLab
- Visual Studio Code
- Google Colab
- PyCharm
Using a virtual environment is also important because different projects may require different library versions.
Definition
What Is a Python for Data Science Cheat Sheet?
A Python for Data Science Cheat Sheet is a concise reference containing commonly used Python syntax, functions, library operations, workflows, and programming patterns relevant to data analysis and machine learning.
It does not replace learning Python. Instead, it acts as a quick-reference tool.
For beginners, it reduces the time spent searching for basic syntax. For experienced professionals, it provides a convenient reminder when switching between projects.
Core Python Data Structures
Python provides several fundamental structures.
| Structure | Typical Purpose |
|---|---|
list | Ordered collection |
tuple | Immutable ordered collection |
dict | Key-value information |
set | Unique values |
str | Text |
int | Whole numbers |
float | Decimal values |
bool | True/False logic |
Understanding these structures is essential before moving into Pandas and machine learning.
Step-by-Step Explanation
Step 1: Import the Required Libraries
A data science project normally begins by importing the required tools.
import numpy as np
import pandas as pd
import matplotlib.pyplot as plt
You may also use:
import seaborn as snsFor machine learning:
from sklearn.model_selection import train_test_splitThe exact imports depend on the project.
Step 2: Load Your Dataset
Pandas provides convenient methods for reading common data formats.
df = pd.read_csv("data.csv")For an Excel workbook:
df = pd.read_excel("data.xlsx")After loading the data, inspect it before making assumptions.
Step 3: Inspect the Dataset
Useful commands include:
df.head()
df.tail()
df.info()
df.describe()
df.shape
df.columns
These operations answer important questions:
- How many records exist?
- What columns are available?
- Which columns contain missing values?
- What data types are present?
- Are numerical values reasonable?
Step 4: Select Data
A column can be selected with:
df["Age"]Multiple columns can be selected with:
df[["Name", "Age", "Salary"]]Rows can be filtered:
df[df["Age"] > 30]Step 5: Handle Missing Data
Missing values are common in real datasets.
You might inspect them using:
df.isna().sum()Possible strategies include:
df.dropna()or:
df.fillna(0)However, blindly replacing missing values is not recommended. The appropriate strategy depends on what the missing value means.
Step 6: Sort and Group Data
Sorting:
df.sort_values("Salary")Grouping:
df.groupby("Department")["Salary"].mean()Grouping is particularly useful for business reports, engineering analysis, and scientific datasets.
Step 7: Visualize the Data
A simple line chart:
plt.plot(df["Month"], df["Sales"])
plt.show()
A histogram:
plt.hist(df["Age"])
plt.show()
A scatter plot:
plt.scatter(df["Experience"], df["Salary"])
plt.show()
Visualization helps transform numerical information into patterns that humans can interpret.
Step 8: Prepare Data for Machine Learning
Machine-learning algorithms generally require carefully prepared features.
Typical preparation includes:
- Removing or handling missing values.
- Encoding categorical variables.
- Selecting useful features.
- Separating input variables from the target.
- Splitting data into training and testing sets.
- Applying appropriate preprocessing.
For example:
X = df.drop("Target", axis=1)
y = df["Target"]
Then:
X_train, X_test, y_train, y_test = train_test_split(
    X, y, test_size=0.2, random_state=42
)
Step 9: Build and Evaluate a Model
A simplified Scikit-learn workflow is:
model.fit(X_train, y_train)

predictions = model.predict(X_test)
The evaluation method depends on the problem.
Classification may use metrics such as accuracy, precision, recall, and F1-score.
Regression may use metrics such as MAE, MSE, RMSE, or R².
Comparison
Python Data Science Libraries Compared
| Library | Main Role | Typical User |
|---|---|---|
| NumPy | Numerical computing | Engineers, scientists |
| Pandas | Data manipulation | Analysts, researchers |
| Matplotlib | Visualization | Almost everyone |
| Seaborn | Statistical visualization | Analysts, data scientists |
| Scikit-learn | Machine learning | Data scientists |
| TensorFlow | Deep learning | AI professionals |
| PyTorch | Deep learning and research | AI researchers |
| SciPy | Scientific computing | Engineers and scientists |
NumPy vs Pandas
NumPy focuses primarily on numerical arrays and mathematical operations.
Pandas focuses on structured data, particularly tables containing rows and columns.
A useful rule is:
🔢 Use NumPy when numerical arrays are central; 🐼 use Pandas when your data behaves like a table.
Diagrams & Tables
Python Data Science Architecture
                RAW DATA
                   │
                   ▼
          ┌─────────────────┐
          │      Pandas     │
          │ Load & Clean    │
          └────────┬────────┘
                   │
                   ▼
          ┌─────────────────┐
          │     NumPy       │
          │ Numerical Work  │
          └────────┬────────┘
                   │
                   ▼
          ┌─────────────────┐
          │ Visualization   │
          │ Matplotlib      │
          │ Seaborn         │
          └────────┬────────┘
                   │
                   ▼
          ┌─────────────────┐
          │ Machine Learning│
          │ Scikit-learn    │
          └────────┬────────┘
                   │
                   ▼
              INSIGHTS
Quick Pandas Reference
| Task | Example |
|---|---|
| Read CSV | pd.read_csv() |
| First rows | df.head() |
| Last rows | df.tail() |
| Dataset information | df.info() |
| Statistics | df.describe() |
| Column names | df.columns |
| Missing values | df.isna() |
| Remove missing rows | df.dropna() |
| Replace missing values | df.fillna() |
| Sort | df.sort_values() |
| Group | df.groupby() |
| Remove column | df.drop() |
| Export CSV | df.to_csv() |


Examples
Example 1: Sales Analysis
Imagine an engineering company stores monthly equipment sales in a CSV file.
Python can:
- Load the file.
- Identify missing records.
- Group sales by region.
- Find the strongest-performing products.
- Create monthly charts.
- Export a cleaned report.
The analyst does not need to manually calculate every value in a spreadsheet.
Example 2: Sensor Data
An industrial facility may collect temperature, pressure, vibration, and operating-status data.
Python can process thousands or millions of sensor records and help engineers identify unusual patterns.
Pandas can organize the measurements, while visualization libraries can reveal trends.
Example 3: Customer Analytics
An online business might analyze:
- Customer age groups
- Purchase frequency
- Product categories
- Website activity
- Geographic regions
Python can transform these raw records into useful customer segments and predictive models.
Example 4: Predictive Maintenance
Machine-learning models can analyze historical equipment information to identify patterns associated with future failures.
Python can connect the data preparation, visualization, modeling, and evaluation stages in one workflow.
Real-World Applications
Engineering
Engineers use Python for:
- Sensor-data analysis
- Simulation
- Quality control
- Predictive maintenance
- Structural monitoring
- Energy analysis
- Process optimization
Finance and Business
Python supports:
- Customer analytics
- Fraud detection
- Forecasting
- Risk analysis
- Automated reporting
- Financial data processing
Healthcare Research
Researchers can use Python to organize datasets, analyze experimental information, visualize trends, and develop statistical or machine-learning models.
Manufacturing
Manufacturers can combine Python with industrial datasets to monitor production lines, detect anomalies, and improve operational efficiency.
Artificial Intelligence
Python is one of the major programming languages used throughout modern AI development, from data preparation to model training and evaluation.
Common Mistakes
Ignoring Data Quality
A sophisticated model cannot compensate for fundamentally unreliable data.
Always inspect the dataset before modeling.
Using the Wrong Data Type
A numerical-looking column may actually contain text values.
For example, "100" and 100 are not equivalent Python objects.
Modifying Data Without Understanding It
Deleting missing values, removing outliers, or replacing unusual records without investigating their meaning can introduce bias.
Data Leakage
Data leakage occurs when information that should be unavailable during model training accidentally enters the training process.
This can produce impressive-looking results that fail in real-world use.
Overusing Machine Learning
Not every data problem requires AI.
Sometimes a simple Pandas analysis or visualization provides the best solution.
Forgetting Reproducibility
Professionals should document:
- Python version
- Library versions
- Data sources
- Processing steps
- Model settings
- Random seeds where appropriate
Challenges & Solutions
| Challenge | Practical Solution |
|---|---|
| Large datasets | Process data efficiently and avoid unnecessary copies |
| Missing values | Investigate their cause before choosing a treatment |
| Messy columns | Standardize names and data types |
| Slow code | Profile the workflow and optimize bottlenecks |
| Visualization overload | Use charts that answer specific questions |
| Model overfitting | Use proper validation techniques |
| Reproducibility | Record environments and project parameters |
| Complex projects | Separate code into reusable functions/modules |
Performance Challenge
Beginners often use Python loops for operations that Pandas or NumPy can perform efficiently.
Instead of processing every record manually, learn how vectorized operations work.
Scaling Challenge
A dataset that works perfectly on a laptop may become difficult to process as it grows.
At larger scales, professionals may consider optimized file formats, chunk processing, databases, distributed computing, or cloud-based infrastructure.
Case Study
Predictive Maintenance for Industrial Equipment
Consider a manufacturing facility monitoring a group of industrial pumps.
Each pump generates information such as:
- Temperature
- Pressure
- Vibration
- Operating hours
- Maintenance history
- Failure status
The engineering team wants to identify pumps that may require maintenance.
Data Preparation
Pandas can load and organize historical records.
The team checks for:
- Missing sensor measurements
- Duplicate records
- Incorrect timestamps
- Impossible readings
- Inconsistent equipment identifiers
Exploration
Visualization helps engineers identify unusual behavior.
For example, they may discover that vibration patterns gradually change before certain failures.
Modeling
The cleaned dataset can then be prepared for a machine-learning model.
The model learns from historical examples and generates predictions for new equipment records.
Engineering Decision
The final system should not simply say that a pump is “likely to fail.”
A useful engineering system should provide actionable information, such as which equipment requires inspection and why the prediction should be investigated.
This illustrates an important principle:
Data science is not just about creating models—it is about turning reliable data into useful decisions.
Essential Tips
Build Your Python Foundation
Before attempting advanced machine learning, understand:
- Variables
- Conditions
- Loops
- Functions
- Lists
- Dictionaries
- Exceptions
- Modules
- File handling
- Object-oriented concepts
Learn Pandas Thoroughly
For many data-science projects, Pandas is more immediately useful than advanced machine-learning techniques.
Learn how to:
- Filter
- Sort
- Group
- Merge
- Reshape
- Clean
- Aggregate
- Export
Visualize Before Modeling
📊 Explore first, model second.
Visualization can reveal missing values, outliers, trends, clusters, and unexpected relationships before a model is trained.
Write Reusable Code
Instead of repeatedly writing the same operations, create functions.
def clean_data(data):
    data = data.drop_duplicates()
    return data
Reusable functions make projects easier to maintain.
Keep a Project Structure
A professional project might look like:
data-science-project/
│
├── data/
├── notebooks/
├── src/
├── models/
├── reports/
├── tests/
└── README.md
Use Git
Version control allows professionals to track changes, collaborate, and recover previous versions of their projects.
Don’t Memorize Everything
A cheat sheet exists precisely because memorizing every function is unnecessary.
Focus on understanding what you need to accomplish and knowing which library or operation can help you accomplish it.
FAQs
What is Python for Data Science?
Python for Data Science refers to using Python and its ecosystem of libraries to collect, clean, analyze, visualize, and model data.
Is Python difficult for beginners?
Python is generally considered beginner-friendly because its syntax is relatively readable. However, data science also requires understanding statistics, data structures, and analytical thinking.
Which Python library should I learn first?
For data science, a practical progression is Python fundamentals → NumPy → Pandas → Matplotlib/Seaborn → Scikit-learn.
Is Pandas better than Excel?
They serve different purposes. Excel is excellent for interactive spreadsheet work, while Pandas is particularly powerful for programmable, repeatable, and large-scale data-processing workflows.
Do I need advanced mathematics to learn Python for Data Science?
You can begin data analysis without advanced mathematics. However, statistics, probability, linear algebra, and mathematical concepts become increasingly important when studying advanced machine learning and AI.
Is NumPy necessary for data science?
NumPy is highly valuable because many scientific Python libraries use its array concepts and numerical operations. However, beginners can learn Pandas alongside the basic NumPy concepts they encounter.
Can Python handle large datasets?
Yes, but the appropriate approach depends on dataset size and available resources. Large projects may require optimized processing, databases, cloud platforms, distributed systems, or specialized tools.
Is Python enough to become a data scientist?
Python is an important skill, but professional data science requires more than programming. You should also develop knowledge of statistics, data visualization, machine learning, databases, experimentation, domain knowledge, and communication.
Conclusion
🐍 Python for Data Science is best understood as an ecosystem rather than a single programming technique.
Python provides the foundation, while libraries such as NumPy, Pandas, Matplotlib, Seaborn, and Scikit-learn provide specialized capabilities for numerical computing, data manipulation, visualization, and machine learning.
The most effective learning path is practical:
Learn Python → Work with data → Clean it → Explore it → Visualize it → Build models → Evaluate results → Communicate insights.
For beginners, the priority should be developing strong programming and data-handling fundamentals rather than immediately jumping into complicated AI models.
For professionals, the focus should expand toward reproducibility, performance, automation, data quality, model reliability, maintainability, and real-world decision-making.
⚡ Keep this cheat sheet as a quick reference, but remember the bigger principle: good data science is not about knowing the most Python commands—it is about choosing the right method to turn data into reliable knowledge.
🚀 Python + Data + Critical Thinking = Powerful Data Science.




