
Machine Learning Using R: A Complete Practical Guide for Beginners and Engineers
Introduction
Machine learning (ML) has become an essential technology for engineers, researchers, analysts, and technology professionals. It allows computers to discover patterns in data and use those patterns to make predictions or support decisions. From predictive maintenance and energy forecasting to quality control and financial modeling, machine learning is increasingly connected with real engineering workflows.
R is particularly valuable when machine learning involves statistics, data exploration, visualization, experimentation, and predictive modeling. R is a free, open-source environment designed around statistical computing and data analysis, while RStudio provides an integrated development environment that makes working with R projects, scripts, plots, and models easier.


For students, R provides an accessible way to understand the mathematical ideas behind machine learning. For experienced engineers, it provides a powerful environment for transforming experimental data into useful predictive models. ⚙️📊
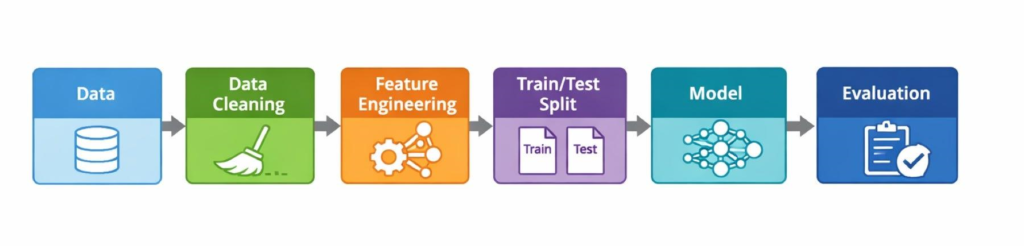
A typical machine-learning project can be viewed as a pipeline:
Data → Cleaning → Exploration → Features → Training → Evaluation → Prediction → Deployment


This article explains how that process works using R, starting with fundamental concepts and progressing toward practical engineering applications.
Background Theory
What is machine learning?
Machine learning is a branch of artificial intelligence in which algorithms learn relationships or patterns from data rather than relying entirely on manually programmed rules.
Suppose an engineer has historical measurements containing:
- Temperature
- Pressure
- Vibration
- Operating speed
- Power consumption
- Machine condition
The objective may be to predict whether a machine will fail.
Instead of writing hundreds of rules such as:
If vibration > X and temperature > Y, then failure probability increases.
an ML algorithm can learn relationships from historical observations.
The general idea can be represented as:
Inputs → Learning Algorithm → Model → Prediction
Supervised and unsupervised learning
Machine learning can be divided into several major categories.
Supervised learning uses data containing known outcomes.
Examples:
- Predicting house prices
- Detecting defective products
- Predicting energy consumption
- Classifying emails
- Estimating equipment lifetime
Unsupervised learning works with data without a predefined target.
Examples include:
- Customer segmentation
- Grouping similar machines
- Detecting unusual measurements
- Discovering hidden data structures
A third important area is reinforcement learning, where an agent learns through interaction with an environment and feedback such as rewards or penalties.
Definition
Machine learning using R
Machine Learning Using R refers to the use of the R programming language and its ecosystem of packages, statistical functions, visualization tools, and modeling frameworks to build, evaluate, interpret, and apply machine-learning models.
R is especially useful when a project requires a strong connection between:
Statistics + Data Analysis + Visualization + Machine Learning
The R ecosystem contains tools for data manipulation, visualization, statistical modeling, resampling, model tuning, and machine learning. RStudio also supports scripting, visualization, debugging, project organization, and reproducible analysis.
Why engineers can benefit from R
Engineering data often has a statistical component.
For example:
- Sensor measurements fluctuate.
- Manufacturing processes contain noise.
- Experimental results contain uncertainty.
- Energy demand changes over time.
- Material properties vary between samples.
- Failure events may be relatively rare.
R allows engineers to investigate these issues before blindly applying an ML algorithm.
That is an important principle:
Good machine learning begins with good data understanding.
Step-by-Step Explanation
Step 1: Install R and an IDE
The first step is to install R and a suitable development environment such as RStudio.
R is the programming language/environment, whereas RStudio is an IDE that provides tools for writing and executing R code, managing projects, inspecting objects, and creating visualizations.
A basic R command looks like:
x <- 10
y <- 20

x + y
The result is:
30
Step 2: Install machine-learning packages
R uses packages to extend its capabilities.
For example:
install.packages("tidymodels")
install.packages("ggplot2")
install.packages("randomForest")
Then load the packages:
library(tidymodels)
library(ggplot2)
library(randomForest)
The exact package combination depends on the problem and modeling strategy.
Step 3: Import the dataset
A CSV file can be imported using:
data <- read.csv("engineering_data.csv")
Inspect the data:
head(data)
str(data)
summary(data)
These commands help identify:
- Variable types
- Missing values
- Unusual ranges
- Numerical variables
- Categorical variables
- Potential errors
Step 4: Explore the data
Visualization is one of R’s major strengths.
For example:
ggplot(data, aes(x = temperature, y = pressure)) +
  geom_point()
This can reveal whether temperature and pressure appear to have a relationship.
Engineers should investigate the data before model training.
Step 5: Clean the dataset
Typical preprocessing tasks include:
- Removing duplicate observations
- Handling missing values
- Correcting incorrect data types
- Detecting extreme observations
- Encoding categorical variables
- Scaling variables when required
For example:
data$temperature <- as.numeric(data$temperature)
Missing values can be investigated with:
colSums(is.na(data))
Step 6: Split the data
A common approach is to divide observations into training and testing datasets.
Conceptually:
Training data → Model learning
Testing data → Unseen evaluation
For example:
set.seed(123)

index <- sample(
  seq_len(nrow(data)),
  size = 0.8 * nrow(data)
)

train <- data[index, ]
test  <- data[-index, ]
The test set should not be used to tune the model repeatedly, because doing so can produce an overly optimistic estimate of performance.
Step 7: Select an algorithm
Different problems require different algorithms.
For regression:
- Linear regression
- Decision trees
- Random forests
- Gradient boosting
- Neural networks
For classification:
- Logistic regression
- Decision trees
- Random forests
- Support vector machines
- Gradient boosting
- Neural networks
For clustering:
- K-means
- Hierarchical clustering
- Density-based methods
Step 8: Train the model
Suppose an engineer wants to predict energy consumption:
model <- lm(
  energy ~ temperature + production + humidity,
  data = train
)
Predictions can then be generated:
predictions <- predict(model, newdata = test)
For more complex relationships, tree-based algorithms can be used.
Step 9: Evaluate performance
For regression, useful metrics include:
MAE
RMSE
where:
- = actual value
- = predicted value
- = number of observations
For classification, common metrics include:
- Accuracy
- Precision
- Recall
- F1-score
- ROC-AUC
Step 10: Interpret the model
A model with high accuracy is not automatically a good engineering solution.
Engineers should also ask:
- Why did the model make this prediction?
- Which variables are important?
- Is the model stable?
- Does it behave sensibly outside the training range?
- Can its predictions be explained?
Interpretability becomes particularly important in safety-critical engineering applications.
Comparison
R vs Python for machine learning
| Feature | R | Python |
|---|---|---|
| Statistical analysis | ⭐⭐⭐⭐⭐ | ⭐⭐⭐⭐ |
| Data visualization | ⭐⭐⭐⭐⭐ | ⭐⭐⭐⭐ |
| Machine learning | ⭐⭐⭐⭐⭐ | ⭐⭐⭐⭐⭐ |
| Deep learning ecosystem | ⭐⭐⭐ | ⭐⭐⭐⭐⭐ |
| Statistical research | ⭐⭐⭐⭐⭐ | ⭐⭐⭐⭐ |
| Beginner data analysis | ⭐⭐⭐⭐ | ⭐⭐⭐⭐ |
| Engineering experimentation | ⭐⭐⭐⭐⭐ | ⭐⭐⭐⭐⭐ |
| Production software | ⭐⭐⭐ | ⭐⭐⭐⭐⭐ |
Neither language is universally superior.
R is particularly attractive when the workflow emphasizes statistics, visualization, experimentation, and analytical reporting. Python often has an advantage when a machine-learning system must be integrated deeply into a broader software application.
Diagrams & Tables
Machine-learning pipeline
A useful conceptual diagram is:
┌─────────────┐
│ Raw Data    │
└──────┬──────┘
       ↓
┌─────────────┐
│ Data Clean  │
└──────┬──────┘
       ↓
┌─────────────┐
│ Exploration │
└──────┬──────┘
       ↓
┌─────────────┐
│ Features    │
└──────┬──────┘
       ↓
┌────────────────┐
│ Train the Model│
└───────┬────────┘
        ↓
┌────────────────┐
│ Evaluate Model │
└───────┬────────┘
        ↓
┌────────────────┐
│ Prediction     │
└────────────────┘


Common algorithms
| Algorithm | Typical task | Main advantage |
|---|---|---|
| Linear Regression | Regression | Simple and interpretable |
| Logistic Regression | Classification | Strong statistical foundation |
| Decision Tree | Classification/Regression | Easy to understand |
| Random Forest | Both | Robust and flexible |
| Gradient Boosting | Both | Strong predictive performance |
| K-Means | Clustering | Simple segmentation |
| Neural Network | Complex prediction | Learns nonlinear patterns |
Examples
Example 1: Predicting equipment energy consumption
Imagine a manufacturing facility collecting:
- Machine temperature
- Production volume
- Operating hours
- Ambient temperature
- Motor speed
- Historical energy consumption
The target variable is:
Energy consumption (kWh)
A regression model could learn the relationship between these variables.
The engineer could then estimate future energy demand.
Example 2: Detecting defective components
Suppose a factory measures:
- Component diameter
- Surface roughness
- Material hardness
- Manufacturing temperature
- Production speed
The target is:
Defective = Yes/No
This becomes a classification problem.
A random forest or gradient-boosting model could potentially identify combinations of measurements associated with defective products.
Real World Application
Predictive maintenance
One of the most valuable engineering applications of machine learning is predictive maintenance.
Traditional maintenance may follow a schedule:
Inspect machine every 30 days.
Predictive maintenance attempts to estimate machine condition using actual operating data.
Sensor variables may include:
- Vibration
- Temperature
- Pressure
- Acoustic signals
- Motor current
- Rotational speed
A machine-learning model can estimate the probability of abnormal behavior.


Energy engineering
ML using R can also support:
⚡ Energy-demand forecasting
🏢 Building-energy analysis
🌞 Solar-power prediction
🌬️ Wind-power forecasting
🔋 Battery performance analysis
Civil engineering
Possible applications include:
- Concrete strength prediction
- Structural health monitoring
- Traffic forecasting
- Construction cost estimation
- Soil classification
Mechanical engineering
Potential applications include:
- Failure prediction
- Manufacturing optimization
- Tool-wear estimation
- Fault classification
- Performance prediction
Common Mistakes
Using all available data for training
If the model is evaluated using the same observations used for training, performance may appear excellent even when the model performs poorly on new data.
Solution: Keep an independent test dataset.
Ignoring missing values
Machine-learning algorithms may behave unexpectedly when data contains missing or invalid values.
Solution: Investigate missingness before modeling.
Choosing a complicated algorithm too early
A neural network is not automatically better than linear regression.
Solution: Begin with a simple baseline and increase complexity only when justified.
Data leakage
Data leakage occurs when information unavailable at prediction time accidentally enters the model.
For example, using a variable recorded after a machine failure to predict that same failure would produce misleading results.
Solution: Reconstruct the prediction scenario realistically.
Focusing only on accuracy
Accuracy can be misleading when classes are highly imbalanced.
If 99% of machines are healthy, a model that always predicts “healthy” could achieve 99% accuracy while being useless for detecting failures.
Solution: Consider precision, recall, F1-score, ROC-AUC, confusion matrices, and business/engineering costs.
Challenges & Solutions
| Challenge | Why it matters | Possible solution |
|---|---|---|
| Small dataset | Model may not generalize | Cross-validation |
| Missing values | Can distort predictions | Imputation/investigation |
| Imbalanced classes | Minority events may be ignored | Resampling and suitable metrics |
| Too many variables | Can increase complexity | Feature selection |
| Overfitting | Excellent training, poor testing | Regularization/cross-validation |
| Poor measurements | Model learns noise | Improve data collection |
| Model drift | Relationships change | Continuous monitoring |
Overfitting vs underfitting
Overfitting occurs when a model learns the training data too closely.
Underfitting occurs when a model is too simple to capture important relationships.
The ideal model finds a useful balance between complexity and generalization.
Case Study
Predictive maintenance for an industrial pump
Consider an industrial pump equipped with sensors.
The engineering team collects one year of historical measurements.
Variables include:
| Variable | Example role |
|---|---|
| Vibration | Detect mechanical abnormalities |
| Temperature | Monitor thermal condition |
| Pressure | Monitor process behavior |
| Flow rate | Detect operational changes |
| Motor current | Detect load changes |
| Failure status | Prediction target |
The project begins by importing the data into R.
pump <- read.csv("pump_data.csv")

summary(pump)
str(pump)
The engineers visualize the measurements and investigate abnormal observations.
Next, the data is separated into training and testing subsets.
A classification model is trained to predict whether a pump is approaching a failure condition.
The team then evaluates:
- Recall for failure detection
- Precision
- False alarms
- Missed failures
- Overall model stability
The most important metric is not necessarily accuracy.
If missing a failure costs thousands of dollars in downtime, the model should be evaluated according to that operational risk.
Finally, the model is tested against new data.
This illustrates a fundamental engineering principle:
Machine learning is not simply an algorithm-selection problem. It is a complete data-and-decision system.
Essential Tips
Start with statistics
Before learning advanced algorithms, understand:
- Mean and variance
- Correlation
- Probability
- Distributions
- Sampling
- Regression
- Hypothesis testing
R’s statistical orientation makes it especially useful for connecting these concepts to machine learning.
Visualize everything important
A graph can reveal problems that numerical summaries miss.
Use visualization to investigate:
📈 Trends
📊 Distributions
🔗 Relationships
⚠️ Outliers
🎯 Classification patterns
Build a baseline
Always create a simple model first.
For example:
Baseline → Improved model → Tuned model → Final model
This makes it easier to determine whether additional complexity actually improves the result.
Use reproducible workflows
Save your R scripts, package information, datasets, and model settings.
RStudio is designed to support project organization, scripting, visualization, debugging, and reproducible analytical workflows.
Understand the engineering problem
Do not begin with:
“Which machine-learning algorithm should I use?”
Begin with:
“What decision am I trying to improve?”
That question often determines the appropriate target variable, data collection strategy, evaluation metric, and model type.
FAQs
Is R good for machine learning?
Yes. R is particularly strong for statistical modeling, data analysis, visualization, experimentation, and predictive modeling. It provides a broad ecosystem for machine-learning workflows.
Is R difficult for beginners?
R can be learned progressively. Beginners should start with variables, vectors, data frames, functions, data manipulation, visualization, and basic statistics before moving into machine learning.
Do I need advanced mathematics to use machine learning with R?
You can begin with basic algebra and statistics. However, deeper knowledge of probability, statistics, linear algebra, and optimization becomes increasingly valuable when you study advanced algorithms.
What R packages are useful for machine learning?
Useful packages depend on the project. Common choices include tidymodels for modeling workflows, ggplot2 for visualization, and specialized packages for algorithms such as random forests or gradient boosting.
Is R better than Python for machine learning?
Not universally. R is excellent for statistics, visualization, research, and analytical workflows, while Python has a particularly strong ecosystem for general software development, machine learning, and production deployment.
Can engineers use R for real-world projects?
Absolutely. R can support predictive maintenance, quality control, energy forecasting, statistical process analysis, experimental design, reliability studies, and many other engineering applications.
Can R be used for deep learning?
Yes. R can interface with deep-learning frameworks and libraries, although Python generally has a larger ecosystem for cutting-edge deep-learning development.
What should I learn after basic R?
A useful progression is:
R fundamentals → Data manipulation → Visualization → Statistics → Machine learning → Model evaluation → Feature engineering → Model interpretation → Deployment
Conclusion
Machine Learning Using R combines statistical thinking, programming, data visualization, and predictive modeling into a practical engineering workflow. ⚙️📊
The most important lesson is that successful machine learning is not simply about choosing a sophisticated algorithm. The quality of the data, features, validation strategy, evaluation metrics, and engineering assumptions often matters just as much as the algorithm itself.
R provides an excellent environment for understanding this complete process. Beginners can use it to learn fundamental concepts, while experienced engineers can use its statistical and visualization capabilities to investigate complex datasets and develop predictive solutions.
A strong learning path is:
Learn R → Understand data → Explore visually → Build a baseline → Train models → Validate properly → Interpret results → Apply to a real engineering problem.
With consistent practice, projects involving manufacturing, energy, civil infrastructure, mechanical systems, finance, research, and many other fields can become excellent opportunities to apply machine learning using R. 🚀
The goal is not merely to produce a prediction.
The goal is to produce a prediction that is reliable, understandable, measurable, and useful for a real decision.




