
Learning Analytics Methods and Tutorials: A Practical Guide Using R
Introduction
Learning analytics sits at the intersection of education, data science, statistics, and software engineering. Its purpose is to transform educational data—such as grades, attendance, quiz attempts, learning-management-system activity, and assessment results—into useful evidence for improving learning outcomes. 📊🎓
For students and professionals, R is particularly valuable because it combines statistical analysis, visualization, machine learning, and reproducible reporting in one environment.
A typical learning analytics workflow can be represented as:
Educational Data → Cleaning → Exploration → Statistical Analysis → Modeling → Interpretation → Educational Decision
Unlike conventional reporting, learning analytics asks deeper questions:
- Which students are struggling?
- Which learning activities are associated with better performance?
- Can we predict students who may need additional support?
- Which assessment questions are unnecessarily difficult?
- Does engagement correlate with achievement?
- How can instructors evaluate learning interventions?
R provides an accessible way to answer these questions. Its ecosystem includes packages such as tidyverse, ggplot2, dplyr, tidymodels, caret, and rmarkdown, making it suitable for both introductory analysis and advanced research. 🧠💻


Background Theory
What Is Learning Analytics?
Learning analytics is the systematic collection, measurement, analysis, and interpretation of data about learners and learning environments.
The concept is closely related to several disciplines:
| Discipline | Contribution |
|---|---|
| Statistics | Measuring relationships and uncertainty |
| Data Science | Extracting patterns from large datasets |
| Machine Learning | Predicting outcomes |
| Educational Psychology | Understanding learner behavior |
| Software Engineering | Building reliable analytical systems |
| Visualization | Communicating complex results |
| Database Engineering | Managing educational datasets |
A learning analytics system can therefore be viewed as an engineering pipeline rather than simply a collection of statistical techniques.
The Learning Analytics Data Pipeline
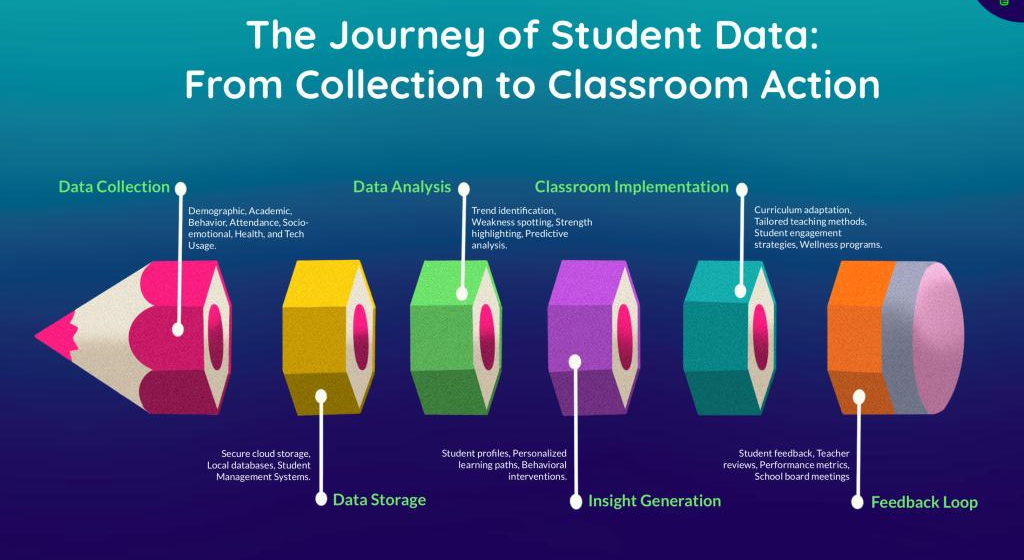
A practical pipeline usually contains six stages:
1. Data acquisition
Collect information from LMS platforms, student-information systems, online quizzes, surveys, or laboratory systems.
2. Data preparation
Remove duplicates, handle missing values, correct inconsistent formats, and identify unusual observations.
3. Exploratory analysis
Investigate distributions, trends, correlations, and differences between groups.
4. Statistical or predictive modeling
Apply regression, classification, clustering, time-series methods, or other techniques.
5. Visualization and reporting
Convert analytical results into understandable graphs, dashboards, and reports.
6. Decision-making
Use evidence to improve teaching, course design, student support, or institutional planning.
Why R Is Useful
R is particularly appropriate when the objective is analytical rather than simply operational.
For example:
library(tidyverse)

students <- read_csv("student_data.csv")

students %>%
  summarise(
    average_score = mean(score, na.rm = TRUE),
    average_attendance = mean(attendance, na.rm = TRUE)
  )
This small example immediately demonstrates one of R’s strengths: statistical calculations can be combined with readable data-manipulation commands.
Definition
Learning Analytics Methods
Learning analytics methods are analytical techniques used to understand, evaluate, monitor, or predict learner behavior and educational outcomes.
Common methods include:
- Descriptive statistics 📈
- Data visualization
- Correlation analysis
- Regression
- Classification
- Clustering
- Time-series analysis
- Survival analysis
- Sentiment analysis
- Sequence analysis
- Association-rule mining
- Predictive analytics
- Social-network analysis
- Anomaly detection
The appropriate method depends on the analytical question.
For example:
Question: What was the average exam score?
Use descriptive statistics.
Question: Does attendance relate to exam performance?
Use correlation or regression.
Question: Which students are likely to fail?
Use classification or predictive modeling.
Question: Are there groups of students with different engagement patterns?
Use clustering.
Step-by-Step Learning Analytics Tutorial Using R
Step 1: Define the Educational Question
Never begin by selecting a machine-learning algorithm.
Start with the educational problem.
For example:
Objective: Identify factors associated with final examination performance.
Possible variables include:
attendanceassignment_scorequiz_scorestudy_hourslms_loginsdiscussion_postsfinal_score
The engineering principle is simple:
Good Question → Appropriate Data → Appropriate Method → Useful Result
Step 2: Import the Data
A CSV file can be imported using:
library(tidyverse)

data <- read_csv("students.csv")

head(data)
Then inspect the structure:
str(data)
summary(data)
This stage is essential because incorrect variable types can produce incorrect analyses.
Step 3: Clean the Dataset
Check missing values:
colSums(is.na(data))
Remove duplicated records when appropriate:
data <- data %>%
  distinct()
Convert categorical variables:
data$gender <- as.factor(data$gender)
data$course <- as.factor(data$course)
Missing data should not automatically be deleted. The correct treatment depends on why the values are missing and how much information is affected.
Step 4: Perform Exploratory Data Analysis
A histogram can reveal the distribution of examination scores:
ggplot(data, aes(x = final_score)) +
  geom_histogram(bins = 20) +
  labs(
    title = "Distribution of Final Examination Scores",
    x = "Final Score",
    y = "Number of Students"
  )
A scatter plot can investigate attendance and achievement:
ggplot(data, aes(x = attendance, y = final_score)) +
  geom_point() +
  geom_smooth(method = "lm") +
  labs(
    title = "Attendance vs Final Score",
    x = "Attendance (%)",
    y = "Final Score"
  )


Step 5: Calculate Descriptive Statistics
data %>%
  summarise(
    mean_score = mean(final_score, na.rm = TRUE),
    median_score = median(final_score, na.rm = TRUE),
    sd_score = sd(final_score, na.rm = TRUE)
  )
The mean provides a central estimate, while the standard deviation indicates how widely scores vary.
A useful interpretation might be:
The average examination score is 72%, with substantial variation among students.
However, this does not establish why the variation exists.
Step 6: Analyze Relationships
Correlation can provide an initial investigation:
cor(
  data$attendance,
  data$final_score,
  use = "complete.obs"
)
If the result is 0.65, attendance and final score have a moderately strong positive linear association.
⚠️ Important: correlation does not prove causation.
Students who attend more classes may also study more, have greater motivation, or have different prior knowledge.
Step 7: Build a Regression Model
A basic linear regression model is:
[Y = \beta_0 + \beta_1X_1 + \beta_2X_2 + \epsilon]
For learning analytics:
[FinalScore =
\beta_0 +
\beta_1 Attendance +
\beta_2 AssignmentScore +
\beta_3 QuizScore +
\epsilon]
In R:
model <- lm(
  final_score ~ attendance + assignment_score + quiz_score,
  data = data
)

summary(model)
The coefficients estimate how the predictors are associated with the outcome while controlling for the other variables in the model.
Step 8: Create a Predictive Model
Suppose the objective is to classify students as:
At_RiskNot_At_Risk
A classification model can be created using logistic regression:
model <- glm(
  at_risk ~ attendance + quiz_score + lms_logins,
  data = data,
  family = binomial
)
Predicted probabilities can then be calculated:
data$probability <- predict(
  model,
  type = "response"
)
A threshold such as 0.50 can be used for classification, although the threshold should be selected according to the educational objective and the costs of false positives and false negatives.
Comparison of Learning Analytics Methods
Different analytical methods answer different questions.
| Method | Main Purpose | Example |
|---|---|---|
| Descriptive statistics | Summarize data | Average grade |
| Correlation | Measure association | Attendance vs grade |
| Regression | Explain/predict numerical outcomes | Predict final score |
| Classification | Predict categories | Identify at-risk students |
| Clustering | Discover groups | Student engagement profiles |
| Time series | Analyze change over time | Weekly LMS activity |
| Association rules | Discover item relationships | Quiz-question patterns |
| Network analysis | Study interactions | Discussion participation |
| Anomaly detection | Find unusual behavior | Unexpected activity patterns |
Statistical vs Machine Learning Approaches
Traditional statistical models often emphasize interpretability and inference, whereas machine-learning approaches frequently prioritize predictive performance.
For example:
Statistics:
“What factors are significantly associated with performance?”
Machine Learning:
“How accurately can we predict future performance?”
In professional learning analytics projects, both objectives can be important.
Diagrams, Tables, and Analytical Architecture
Learning Analytics Architecture
A simplified architecture is:
┌───────────────────────┐
│ Educational Platforms │
│ LMS / Exams / Surveys │
└───────────┬───────────┘
            ↓
┌───────────────────────┐
│ Data Collection       │
└───────────┬───────────┘
            ↓
┌───────────────────────┐
│ Data Cleaning         │
│ Missing / Duplicates  │
└───────────┬───────────┘
            ↓
┌───────────────────────┐
│ Exploratory Analysis  │
└───────────┬───────────┘
            ↓
┌───────────────────────┐
│ Statistical / ML Model│
└───────────┬───────────┘
            ↓
┌───────────────────────┐
│ Visualization         │
│ Dashboard / Report    │
└───────────┬───────────┘
            ↓
┌───────────────────────┐
│ Educational Action    │
└───────────────────────┘



Key Metrics
A learning analytics project might monitor:
| Metric | Meaning |
|---|---|
| Completion Rate | Percentage completing a course/activity |
| Attendance | Participation in scheduled learning |
| Assessment Score | Achievement measurement |
| Login Frequency | LMS engagement indicator |
| Time on Task | Approximate learning activity |
| Retention Rate | Students continuing over time |
| Dropout Rate | Students leaving a program |
| Prediction Accuracy | Quality of predictive model |
These metrics should never be interpreted in isolation.
Examples
Example 1: Attendance and Performance
Suppose an engineering course contains 500 students.
An analyst discovers:
- Mean attendance = 78%
- Mean final score = 71%
- Attendance-score correlation = 0.58
This suggests a positive relationship.
However, the result should trigger further investigation, rather than the conclusion that increasing attendance automatically increases grades.
Example 2: Identifying At-Risk Students
A university develops a model using:
- attendance,
- assignment completion,
- quiz performance,
- LMS activity.
The model generates a risk probability:
| Student | Risk Probability |
|---|---|
| A | 0.12 |
| B | 0.31 |
| C | 0.76 |
| D | 0.88 |
Students C and D could be prioritized for academic support.
⚠️ The prediction should support human intervention—not replace academic judgment.
Example 3: Engagement Clustering
Using clustering, students might be grouped into:
⚠️ Group 1: High activity + high performance
⚠️ Group 2: High activity + low performance
Group 3: Low activity + medium performance
Group 4: Low activity + low performance
Each group may require a different intervention.
Real-World Applications
Universities and Colleges
Learning analytics can help institutions monitor course performance, identify difficult modules, evaluate teaching strategies, and detect changes in student engagement.
Online Learning Platforms
MOOCs and digital-learning environments generate enormous amounts of behavioral data.
Analytics can examine:
- Video completion
- Quiz attempts
- Forum activity
- Learning sequences
- Course abandonment
Engineering Education
For engineering programs, learning analytics can analyze laboratory performance, programming assignments, simulation exercises, mathematics assessments, and project milestones.
For example, an engineering department could determine whether students who repeatedly struggle with introductory programming are more likely to encounter difficulty in later computational courses.
Corporate Training
Organizations can use analytics to evaluate employee training completion, assessment results, skill development, and learning effectiveness.
Common Mistakes
Mistake 1: Treating Correlation as Causation
A strong relationship between two variables does not prove that one causes the other.
Mistake 2: Ignoring Missing Data
Deleting every row containing a missing value may introduce bias.
Mistake 3: Using Too Many Predictors
Adding dozens of variables can produce overfitting and make interpretation difficult.
Mistake 4: Evaluating the Model on Training Data
A model can appear highly accurate on the data used to train it but perform poorly on unseen students.
Mistake 5: Ignoring Data Leakage
Data leakage occurs when information unavailable at prediction time accidentally enters the model.
For example, using final examination results to predict whether a student will eventually fail the course is not a valid early-warning system.
Mistake 6: Focusing Only on Accuracy
For imbalanced datasets, accuracy can be misleading.
Suppose only 5% of students are genuinely at risk. A model predicting “not at risk” for everyone achieves 95% accuracy while being completely useless for identifying vulnerable students.
Challenges & Solutions
Data Quality
Challenge: Educational databases may contain inconsistent names, missing values, duplicate records, and incompatible formats.
Solution: Establish a formal data-cleaning pipeline before modeling.
Privacy
Student data can contain highly sensitive information.
Solution: Apply appropriate privacy controls, minimize unnecessary data collection, restrict access, and follow applicable institutional and legal requirements.
Model Interpretability
A complex model may produce accurate predictions without explaining them clearly.
Solution: Use interpretable models where appropriate and complement advanced models with explainability techniques.
Bias
Historical educational data can contain structural biases.
Solution: Evaluate model performance across relevant groups and investigate whether predictions systematically disadvantage particular populations.
Changing Student Behavior
A model developed from historical data may become less accurate when teaching methods, platforms, curricula, or student behavior change.
Solution: Monitor model performance continuously and retrain or recalibrate models when necessary.
Case Study
Predicting Course Failure with R
Consider a hypothetical university engineering course with 2,000 students.
The analytics team collects:
- Weekly attendance
- Assignment submissions
- Quiz scores
- LMS activity
- Previous academic performance
- Midterm examination score
The goal is to identify students who may need support before the final examination.
The project follows this workflow:
2,000 Student Records
        ↓
Data Cleaning
        ↓
Feature Engineering
        ↓
Exploratory Analysis
        ↓
Train/Test Split
        ↓
Logistic Regression
        ↓
Model Evaluation
        ↓
Risk Dashboard
        ↓
Instructor Intervention
The team discovers that midterm performance, assignment completion, and recent engagement are particularly useful predictors.
Instead of automatically labeling students as unsuccessful, the system sends an alert to instructors.
An instructor can then investigate the student’s circumstances and offer:
- additional tutoring,
- office-hour support,
- supplemental exercises,
- academic advising,
- technical assistance.
This distinction is crucial.
Analytics should create opportunities for intervention—not automatic judgments about students. 🎯
Essential Tips
Start With the Question
Do not begin with:
“Which machine-learning algorithm should I use?”
Begin with:
“What educational decision are we trying to improve?”
Visualize Before Modeling
A few well-designed plots can reveal:
- outliers,
- nonlinear relationships,
- unusual distributions,
- missing-data patterns,
- subgroup differences.
Keep Your R Code Reproducible
Use scripts or R Markdown/Quarto documents rather than performing every operation manually.
A reproducible project might contain:
learning-analytics/
│
├── data/
├── scripts/
├── models/
├── figures/
├── reports/
└── README.md
Separate Training and Testing Data
For predictive analytics, use independent test data or appropriate cross-validation.
Evaluate More Than One Metric
Depending on the problem, examine:
- Accuracy
- Precision
- Recall
- F1-score
- Sensitivity
- Specificity
- ROC-AUC
- RMSE
- MAE
- (R^2)
Remember the Educational Context
A statistically significant result may not necessarily be educationally important.
Always ask:
Is the effect meaningful enough to justify an intervention?
FAQs
What is learning analytics?
Learning analytics is the use of learner and educational data to understand learning processes, evaluate performance, identify patterns, and support educational decisions.
Why use R for learning analytics?
R provides extensive statistical, visualization, machine-learning, and reporting capabilities. It is especially useful for researchers, analysts, students, and professionals working with quantitative educational data.
Is R difficult for beginners?
R has a learning curve, but beginners can start with fundamental operations such as importing CSV files, filtering data, calculating statistics, and creating ggplot2 visualizations before progressing to machine learning.
Which R packages are useful for learning analytics?
Useful packages include tidyverse for data manipulation, ggplot2 for visualization, tidymodels for modeling workflows, and reporting tools such as R Markdown or Quarto.
Can R predict students who may fail?
Yes. Classification techniques such as logistic regression, decision trees, random forests, and other machine-learning methods can estimate risk. However, predictions should support—not replace—human educational judgment.
What is the difference between educational data mining and learning analytics?
The fields overlap substantially. Learning analytics often emphasizes using data to understand and improve learning and educational decision-making, while educational data mining traditionally emphasizes computational techniques for discovering patterns in educational datasets.
Does learning analytics require machine learning?
No. Descriptive statistics, visualization, correlation, regression, and other traditional analytical techniques can provide highly valuable learning analytics without machine learning.
What is the most important skill for a learning analytics professional?
The ability to connect analytical methods with meaningful educational questions is arguably more important than knowing a particular algorithm. Technical skills must be combined with statistics, domain knowledge, communication, and ethical awareness.
Conclusion
Learning analytics transforms educational data into actionable evidence. When combined with R, it provides a powerful environment for analyzing everything from basic examination results to large-scale learning-management-system activity. 📊🎓
The most effective workflow is not simply:
Collect Data → Run Machine Learning
Instead, it is:
Educational Problem → Data → Cleaning → Exploration → Appropriate Method → Validation → Interpretation → Educational Action
For beginners, the best starting point is descriptive statistics and visualization. From there, learners can progress to correlation, regression, classification, clustering, predictive analytics, and more advanced methods.
For professionals, the engineering challenge goes beyond model accuracy. A successful learning analytics system must also address data quality, reproducibility, privacy, fairness, interpretability, scalability, and real-world educational impact.
Ultimately, the value of learning analytics is not measured by how sophisticated the R code looks. It is measured by whether the resulting evidence helps educators and learners make better, earlier, and more informed decisions. 🚀📚




