Handbook of Regression Methods: A Practical Guide to Regression Analysis for Engineering, Data Science, and Research


Introduction
Regression analysis is one of the most useful analytical techniques in modern engineering, statistics, and data science. 🔬📊 It provides a structured way to investigate relationships between variables, understand patterns in measured data, and develop models that can support prediction and decision-making.
Engineers encounter regression everywhere. A civil engineer may investigate how concrete strength changes with curing conditions. A mechanical engineer may study how temperature influences equipment efficiency. An electrical engineer may model power consumption from operating conditions. Environmental engineers can use regression to investigate pollutant concentrations, while software and systems engineers can apply regression to performance and reliability data.
The term regression methods does not describe a single technique. Instead, it represents a broad family of statistical and computational approaches. Simple linear regression is only the starting point. Depending on the structure of the data, engineers may use multiple regression, polynomial regression, logistic regression, ridge regression, lasso regression, robust regression, nonlinear regression, or modern regularized approaches.
The objective is not simply to produce a model that fits historical observations. A useful regression model should also be interpretable, statistically defensible, and capable of performing reliably on new observations.


For students, regression offers an accessible introduction to statistical modeling. For professionals, it provides a practical framework for analyzing experiments, monitoring systems, forecasting performance, and optimizing engineering processes.
Background Theory
Regression developed from the broader field of statistical analysis and has become an essential component of modern quantitative research.
At its core, regression attempts to describe how an output variable changes in relation to one or more input variables. The output is often called the response, dependent variable, or target. The inputs may be called predictors, explanatory variables, or independent variables.
The Basic Modeling Concept
Consider an engineering experiment involving several measurements. Each observation contains information about operating conditions and a measured result.
Regression attempts to identify a systematic relationship within these observations while separating that relationship from random variation and measurement noise.
This distinction is important.
Real engineering systems rarely behave perfectly. Sensors have errors, manufacturing processes vary, environmental conditions fluctuate, and some relevant variables may not have been measured.
Therefore, regression should be viewed as a model of reality, not reality itself.
Why Regression Is Important
Regression methods are particularly valuable because they can perform several different roles:
- 📈 Describe relationships between variables.
- 🔮 Predict future or unknown observations.
- 🧪 Analyze experimental results.
- ⚙️ Support engineering design decisions.
- 🏭 Monitor industrial processes.
- 🌍 Model environmental behavior.
- 🏗️ Estimate structural or material performance.
- 💡 Identify influential factors.
- 🤖 Provide statistical foundations for machine learning.
Definition
Regression analysis is a statistical modeling approach used to examine, quantify, and predict relationships between a response variable and one or more explanatory variables.
A regression model generally contains three conceptual components:
- Response variable — what we want to understand or predict.
- Predictor variables — factors potentially related to the response.
- Error or unexplained variation — differences that the model cannot explain.
Major Regression Categories
Regression techniques can be grouped according to the characteristics of the problem.
| Method | Typical Purpose | Example Engineering Use |
|---|---|---|
| Simple linear regression | One predictor | Temperature vs. efficiency |
| Multiple linear regression | Several predictors | Strength from material properties |
| Polynomial regression | Curved relationships | Calibration studies |
| Logistic regression | Classification probabilities | Failure/no-failure prediction |
| Ridge regression | Handle correlated predictors | Sensor-rich systems |
| Lasso regression | Variable selection | Feature screening |
| Elastic Net | Combined regularization | High-dimensional datasets |
| Robust regression | Reduce outlier influence | Experimental measurements |
| Nonlinear regression | Complex physical relationships | Equipment performance |
| Quantile regression | Model different parts of a distribution | Risk and reliability studies |
Step-by-Step Regression Analysis
A reliable regression project requires more than selecting a statistical function. The quality of the final model depends heavily on the quality of the data and the decisions made before and after modeling.


Step 1: Define the Engineering Question
Begin with a clear question.
Instead of asking:
“Can I build a regression model?”
ask:
“Which operating factors are associated with equipment energy consumption?”
A precise question determines what data should be collected and what modeling method is appropriate.
Step 2: Identify Variables
Determine the response variable and potential predictors.
For example, an industrial study might contain:
- Equipment temperature
- Operating speed
- Load
- Pressure
- Ambient conditions
- Energy consumption
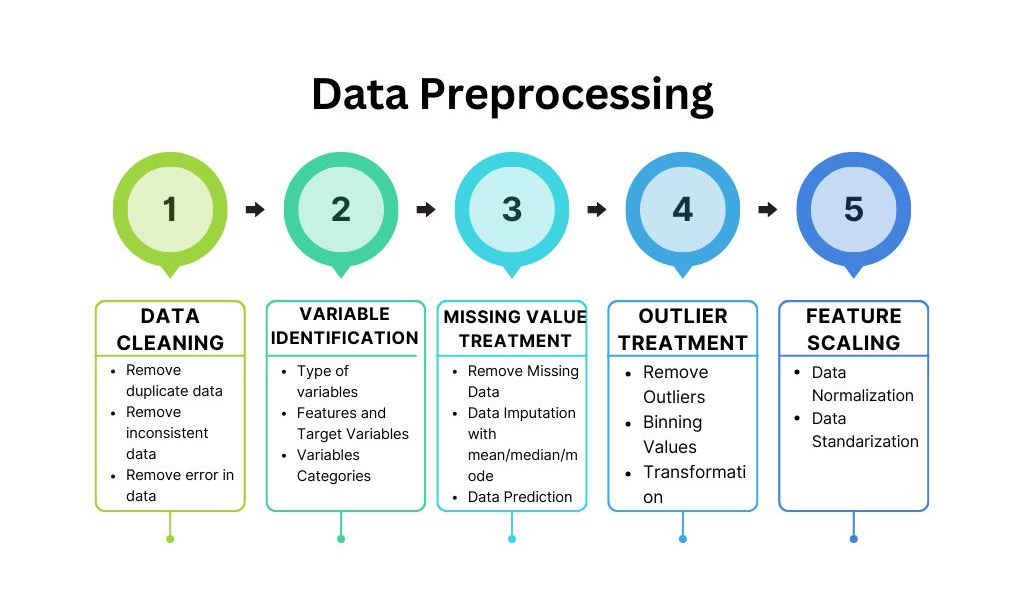
Step 3: Collect and Inspect Data
Data should be examined before modeling.
Check for:
- Missing observations
- Duplicate records
- Impossible values
- Measurement errors
- Outliers
- Incorrect units
- Sampling problems
Step 4: Explore the Data
Visualization is extremely useful. 📊
Scatter plots, histograms, box plots, and correlation displays can reveal patterns that are difficult to detect from tables alone.
Step 5: Select an Appropriate Model
A simple relationship may require only linear regression.
A more complicated problem could require:
- Multiple regression
- Polynomial regression
- Regularized regression
- Robust regression
- Nonlinear regression
- Logistic regression
Step 6: Train the Model
The available observations are used to estimate the model parameters.
For predictive applications, data should generally be separated into training and testing portions, or analyzed using an appropriate cross-validation strategy.
Step 7: Evaluate the Model
Model evaluation should consider more than a single performance metric.
Engineers may examine:
- Prediction error
- Residual behavior
- Goodness of fit
- Generalization performance
- Stability
- Interpretability
- Physical plausibility
Step 8: Validate the Results
Validation asks an important question:
Does the model make sense outside the original dataset?
A statistically impressive model can still be scientifically useless if it violates known engineering principles.
Step 9: Communicate the Findings
A good engineering report should explain:
- What was modeled
- Why the method was selected
- What the important variables were
- How reliable the predictions are
- What limitations exist
- How the results should be used
Comparison of Regression Methods
Different regression methods solve different problems. Choosing the most complicated technique is not automatically better.
Linear vs. Polynomial Regression
Linear regression works well when the relationship can reasonably be represented by a straight-line trend.
Polynomial regression allows curved relationships and can be useful when the response changes direction as a predictor changes.
However, excessive polynomial complexity can create unstable predictions.
Ridge vs. Lasso Regression
Ridge regression is particularly useful when predictors are strongly correlated.
Lasso regression can shrink some predictor contributions toward zero, making it useful for feature selection.
Elastic Net combines characteristics of both approaches.
Classical vs. Robust Regression
Classical regression can be sensitive to unusual observations.
Robust regression reduces the influence of observations that could otherwise dominate the fitted relationship.
This can be particularly valuable in engineering experiments where occasional measurement anomalies occur.
Diagrams, Tables, and Visual Interpretation


A regression workflow can be visualized as:
Raw Data → Data Cleaning → Exploration → Model Selection → Model Training → Diagnostics → Validation → Engineering Decision
Regression Method Selection Table
| Problem Characteristic | Suitable Starting Method |
|---|---|
| One continuous predictor | Simple linear regression |
| Several continuous predictors | Multiple regression |
| Curved relationship | Polynomial or nonlinear regression |
| Strong predictor correlation | Ridge regression |
| Many unnecessary predictors | Lasso regression |
| Mixed regularization requirements | Elastic Net |
| Extreme observations | Robust regression |
| Binary outcome | Logistic regression |
| Different distribution regions | Quantile regression |
Residual Diagnostics
Residuals are particularly important because they represent the portion of observations not explained by the model.
A useful residual analysis can reveal:
- Nonlinear patterns
- Unequal variability
- Outliers
- Missing variables
- Model misspecification
If residuals show a strong systematic pattern, the model may not adequately represent the underlying process.
Examples Without Equations or Mathematics
Example 1: Concrete Strength
A civil engineering laboratory collects measurements from concrete specimens.
Potential predictors include:
- Cement content
- Water content
- Aggregate characteristics
- Curing duration
- Temperature
The response is concrete compressive strength.
Regression can help identify which variables are associated with stronger concrete and can support preliminary prediction of performance.
Example 2: Manufacturing Energy Consumption
An industrial facility records energy consumption for a production machine.
The dataset includes:
- Production rate
- Machine temperature
- Operating duration
- Material throughput
- Equipment status
A regression model can identify major drivers of energy use and support energy-efficiency initiatives.
Example 3: Bridge Monitoring
Sensors installed on a bridge collect information about environmental and structural conditions.
Regression can help establish relationships between environmental conditions and measured structural responses.
This can provide engineers with a baseline against which unusual behavior can be investigated.
Real-World Applications
Regression methods are used across almost every engineering discipline.
Civil Engineering 🏗️
Applications include:
- Concrete performance prediction
- Settlement estimation
- Traffic modeling
- Construction productivity
- Structural monitoring
- Pavement deterioration
Mechanical Engineering ⚙️
Regression can support:
- Equipment performance analysis
- Thermal system modeling
- Predictive maintenance
- Manufacturing optimization
- Fuel consumption studies
- Reliability analysis
Electrical Engineering ⚡
Common applications include:
- Load forecasting
- Power consumption analysis
- Battery performance
- Sensor calibration
- Renewable-energy prediction
- Equipment condition monitoring
Environmental Engineering 🌍
Regression is useful for:
- Air-quality modeling
- Water-quality assessment
- Pollution prediction
- Environmental monitoring
- Waste-management analysis
Data Science and AI 🤖
Regression is one of the foundational supervised learning approaches.
It provides a bridge between traditional statistics and modern machine learning, particularly when predictive models need to remain interpretable.
Common Mistakes
Mistake 1: Assuming Correlation Means Causation
A strong statistical relationship does not automatically prove that one variable causes another.
Mistake 2: Ignoring Data Quality
A sophisticated algorithm cannot compensate for unreliable measurements.
Mistake 3: Using Too Many Predictors
Including every available variable may produce an unnecessarily complicated model and increase the risk of overfitting.
Mistake 4: Ignoring Outliers
Outliers should not automatically be deleted. First determine whether they represent:
- Measurement errors
- Genuine rare events
- Different operating conditions
- Data-entry problems
Mistake 5: Evaluating Only Training Performance
A model can fit historical observations extremely well while performing poorly on new data.
Mistake 6: Ignoring Engineering Knowledge
A statistically strong relationship can still conflict with established physical behavior.
Challenges and Solutions
Challenge: Limited Data
Small datasets can make model estimates unstable.
Solution: Improve experimental design, collect additional observations, simplify the model, and use suitable validation techniques.
Challenge: Multicollinearity
Predictors may contain overlapping information.
Solution: Examine predictor relationships and consider dimensionality reduction or regularization methods.
Challenge: Nonlinear Relationships
A straight-line model may fail to capture important behavior.
Solution: Investigate transformations, polynomial approaches, splines, or nonlinear regression.
Challenge: Changing Variability
The spread of observations may change across the predictor range.
Solution: Examine residual diagnostics and consider transformations or models designed for nonconstant variance.
Challenge: Outliers
Extreme observations can disproportionately influence classical regression.
Solution: Investigate the source of the observations and consider robust methods when appropriate.
Challenge: Model Drift
Industrial systems can change over time because of equipment aging, maintenance, process changes, or environmental conditions.
Solution: Monitor model performance continuously and periodically retrain or recalibrate models.
Case Study: Predicting Industrial Equipment Performance
Imagine a manufacturing company operating a group of high-speed production machines.
Engineers notice that energy consumption differs considerably between production shifts.
Data Collection
The engineering team gathers historical information about:
- Production volume
- Machine operating hours
- Ambient temperature
- Machine temperature
- Material throughput
- Maintenance events
- Energy consumption
Initial Investigation
Exploratory analysis indicates that production volume and machine operating time are strongly related to energy consumption. However, some observations appear unusually high.
Rather than deleting those observations immediately, engineers investigate the corresponding maintenance records.
They discover that several unusual observations occurred shortly before maintenance interventions.
Model Development
The team compares several regression approaches.
A basic model provides a useful baseline but does not adequately capture the unusual observations.
A more robust model performs better because extreme observations have less influence.
The engineers also test the model on observations not used during development.
Engineering Interpretation
The final model reveals that machine operating conditions and production intensity are important predictors of energy use.
The company can now use the model to:
- Detect unusual consumption
- Compare machine performance
- Investigate maintenance requirements
- Estimate expected energy use
- Identify opportunities for efficiency improvements
The key lesson is that model development and engineering investigation should work together.
Essential Tips
Build Simple Models First
Start with an interpretable baseline before moving toward advanced techniques.
Visualize Before Modeling
📊 A good plot can reveal problems that statistics alone may hide.
Separate Prediction From Explanation
A model optimized for prediction is not necessarily the best model for explaining causal mechanisms.
Keep Engineering Context
Statistical results should always be interpreted within the physical and operational context of the system.
Validate Properly
Use independent testing or cross-validation where appropriate.
Monitor Models After Deployment
A regression model can become outdated when the underlying process changes.
Document Everything
Record:
- Data sources
- Cleaning decisions
- Variables
- Modeling choices
- Validation procedures
- Assumptions
- Limitations
Good documentation makes engineering models reproducible and auditable.
Frequently Asked Questions
What is regression analysis?
Regression analysis is a statistical method for studying relationships between an outcome and one or more explanatory variables. It can be used for explanation, prediction, forecasting, and engineering decision support.
Is regression useful for engineering students?
Yes. Regression is valuable for laboratory analysis, experimental research, design studies, quality control, and data-driven engineering projects.
What is the simplest regression method?
Simple linear regression is usually the easiest starting point because it examines the relationship between one predictor and one continuous response.
When should I use multiple regression?
Multiple regression is appropriate when several factors may simultaneously influence the response and you want to evaluate their relationships within the same model.
What is overfitting?
Overfitting occurs when a model learns the peculiarities or noise of its training observations too closely and consequently performs poorly on new data.
Are outliers always bad?
No. An outlier may be a measurement error, but it may also represent an important real event. Engineers should investigate unusual observations before removing them.
Can regression be used with machine learning?
Absolutely. Regression is both a classical statistical technique and a major category of supervised machine learning.
Which regression method is best?
There is no universally best method. The appropriate approach depends on the response variable, predictor structure, data quality, objectives, assumptions, sample size, and engineering context.
Conclusion
Regression methods form one of the most important foundations of quantitative engineering analysis. 📈⚙️ From basic linear relationships to regularized, robust, nonlinear, and classification-oriented approaches, regression provides engineers and researchers with a flexible toolkit for transforming observations into useful information.
The most effective regression workflow begins long before model training. Defining the engineering question, collecting reliable data, exploring relationships, selecting an appropriate method, validating predictions, and interpreting results within physical constraints are all essential.
For beginners, the best strategy is to start with simple and interpretable models. For advanced users, regularization, robust modeling, nonlinear methods, diagnostics, and modern machine-learning workflows provide additional capabilities.
Ultimately, regression should not be treated as a button that automatically produces answers. It is a framework for reasoning from data. When statistical methods are combined with sound engineering judgment, regression can support better designs, more reliable systems, improved efficiency, stronger research, and smarter technical decisions. 🔬📊🚀