
Elements of Data Science: Getting Started with Data Science and Python
Introduction
📊 Data science has become one of the most important technical disciplines in modern engineering, business, research, healthcare, finance, and technology. Organizations generate enormous quantities of information every day, but raw data has limited value until it can be transformed into useful knowledge.
Data science provides a systematic approach for turning raw observations into insights, predictions, and decisions. Python has become one of the most popular programming languages for this process because it combines relatively simple syntax with a powerful ecosystem of scientific and machine-learning libraries.
For beginners, data science can initially appear complicated because it combines several areas:
- 🐍 Python programming
- 📐 Mathematics and statistics
- 🗃️ Data management
- 📊 Data visualization
- 🤖 Machine learning
- 🔬 Scientific computing
- 🧠 Problem-solving and domain knowledge
However, these elements do not have to be learned simultaneously. A structured approach allows students and engineers to progress from basic Python operations toward sophisticated analytical systems.


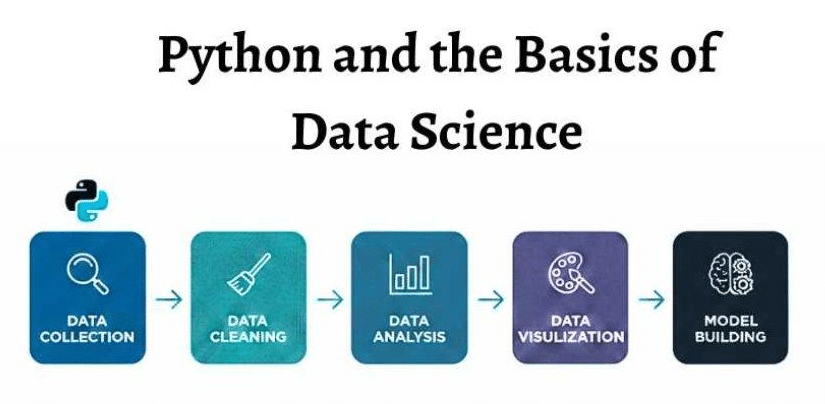
The fundamental idea is simple:
Raw Data → Processing → Analysis → Insight → Decision
This article explains the essential elements of data science and provides a practical introduction to using Python for engineering and analytical problems.
Background Theory
What Is Data Science?
Data science is an interdisciplinary field that combines programming, statistics, mathematics, computational techniques, and domain expertise to extract meaningful information from data.
A simplified mathematical representation is:
Data → Model → Prediction/Insight
Suppose an engineering company records:
- Temperature
- Pressure
- Vibration
- Machine speed
- Energy consumption
- Failure events
A data scientist can investigate relationships among these variables and develop a model capable of estimating whether a machine is likely to fail.
The Data Science Lifecycle
A typical data science project follows several stages:
- Problem definition
- Data collection
- Data cleaning
- Exploratory analysis
- Feature engineering
- Model development
- Model evaluation
- Deployment
- Monitoring
⚙️ Importantly, this is not always a straight line. Engineers frequently move backward when they discover missing data, incorrect assumptions, or poor model performance.
Why Python?
Python is particularly useful because its ecosystem includes specialized tools for almost every stage of the workflow.
| Purpose | Common Python Technology |
|---|---|
| Numerical computation | NumPy |
| Data manipulation | pandas |
| Visualization | Matplotlib |
| Statistical analysis | SciPy |
| Machine learning | scikit-learn |
| Deep learning | PyTorch / TensorFlow |
| Interactive analysis | Jupyter |
| Data storage | SQL connectors / databases |
The strength of Python comes less from the language alone and more from the combination of its libraries.
Definition
Essential Elements of Data Science
The major elements can be organized into six interconnected areas.
1. Data
Data is the raw material of data science.
It may be:
- Numerical
- Categorical
- Textual
- Image-based
- Audio
- Sensor measurements
- Time-series information
- Geospatial information
2. Statistics
Statistics helps answer questions such as:
What happened?
How frequently did it happen?
Is the observed relationship meaningful?
Important concepts include:
- Mean
- Median
- Variance
- Standard deviation
- Probability
- Correlation
- Regression
- Hypothesis testing
3. Programming
Programming allows analysts to automate repetitive operations.
Instead of manually processing 1,000,000 measurements, Python can perform the same operation programmatically.
4. Visualization
Charts help humans understand patterns that may be difficult to detect in tables.
Examples include:
📈 Line charts
📊 Bar charts
🔵 Scatter plots
🔥 Heat maps
📦 Box plots
5. Machine Learning
Machine learning allows computers to learn patterns from historical data and use those patterns to make predictions or classifications.
6. Domain Knowledge
A technically accurate model can still produce poor decisions if the engineer does not understand the application.
For example, an engineer analyzing vibration data must understand machinery behavior, not simply the mathematics behind a machine-learning algorithm.
Step-by-Step Explanation
Step 1: Define the Problem
Before writing Python code, define the engineering or business question.
For example:
Can historical temperature and vibration measurements be used to predict machine failure?
This question determines what data is required and what type of model might be appropriate.
Step 2: Collect Data
Data can originate from:
- Databases
- Sensors
- CSV files
- APIs
- Laboratory experiments
- Enterprise systems
- Public datasets
A simple Python example for loading a CSV file is:
import pandas as pd

data = pd.read_csv("machine_data.csv")

print(data.head())
Step 3: Inspect the Dataset
Before analysis, inspect the structure.
print(data.shape)
print(data.columns)
print(data.info())
These commands can reveal the number of observations, available variables, and potential data-quality problems.
Step 4: Clean the Data
Real datasets are rarely perfect.
They can contain:
- Missing values
- Duplicate records
- Incorrect measurements
- Outliers
- Inconsistent units
- Incorrect data types
For example:
data = data.drop_duplicates()
data = data.dropna()
However, blindly deleting missing observations is not always appropriate. The correct method depends on why the data is missing.
Step 5: Explore the Data
Exploratory Data Analysis, or EDA, helps identify patterns.
print(data.describe())
Visualization can provide additional insight:
import matplotlib.pyplot as plt

data["temperature"].plot()
plt.title("Temperature Measurements")
plt.xlabel("Observation")
plt.ylabel("Temperature")
plt.show()
Step 6: Identify Relationships
Suppose machine temperature increases before failure.
A scatter plot can help investigate this relationship.
plt.scatter(data["temperature"], data["failure"])
plt.xlabel("Temperature")
plt.ylabel("Failure")
plt.show()
Step 7: Build a Model
A classification model might predict whether a failure will occur.
from sklearn.model_selection import train_test_split
from sklearn.ensemble import RandomForestClassifier

X = data[["temperature", "vibration", "pressure"]]
y = data["failure"]

X_train, X_test, y_train, y_test = train_test_split(
    X, y, test_size=0.2, random_state=42
)

model = RandomForestClassifier(random_state=42)
model.fit(X_train, y_train)
Step 8: Evaluate the Model
A model should never be considered successful simply because it produces predictions.
Engineers should evaluate appropriate metrics such as:
- Accuracy
- Precision
- Recall
- F1-score
- Mean absolute error
- Root mean squared error
- ROC-AUC
The metric depends on the problem.


Comparison
Traditional Data Analysis vs Data Science
| Feature | Traditional Analysis | Data Science |
|---|---|---|
| Primary goal | Understand existing data | Understand and predict |
| Programming | Sometimes limited | Usually important |
| Statistics | Important | Highly important |
| Machine learning | Limited | Frequently used |
| Automation | Moderate | High |
| Data volume | Small to medium | Small to massive |
| Visualization | Common | Essential |
| Deployment | Less common | Often required |
Python vs Other Languages
| Characteristic | Python | R | MATLAB |
|---|---|---|---|
| Beginner friendliness | ⭐⭐⭐⭐⭐ | ⭐⭐⭐⭐ | ⭐⭐⭐⭐ |
| Data analysis | Excellent | Excellent | Excellent |
| Machine learning | Excellent | Excellent | Very good |
| Engineering computing | Excellent | Good | Excellent |
| General programming | Excellent | Moderate | Good |
| AI ecosystem | Excellent | Good | Good |
Python is therefore particularly attractive to students who want a combination of engineering, programming, analytics, and artificial intelligence.
Diagrams and Tables
Data Science Pipeline
              ┌─────────────────┐
              │   Raw Data      │
              └────────┬────────┘
                       ↓
              ┌─────────────────┐
              │ Data Cleaning   │
              └────────┬────────┘
                       ↓
              ┌─────────────────┐
              │ Exploratory     │
              │ Analysis        │
              └────────┬────────┘
                       ↓
              ┌─────────────────┐
              │ Feature         │
              │ Engineering     │
              └────────┬────────┘
                       ↓
              ┌─────────────────┐
              │ Machine         │
              │ Learning        │
              └────────┬────────┘
                       ↓
              ┌─────────────────┐
              │ Evaluation      │
              └────────┬────────┘
                       ↓
              ┌─────────────────┐
              │ Decision /      │
              │ Deployment      │
              └─────────────────┘
Typical Python Data Science Stack
              Python
                 │
       ┌─────────┼─────────┐
       ↓         ↓         ↓
     NumPy    pandas   Matplotlib
       │         │         │
       └─────────┼─────────┘
                 ↓
          Data Analysis
                 │
                 ↓
          scikit-learn
                 │
                 ↓
       Machine Learning
Data Types
| Data Type | Example | Possible Analysis |
|---|---|---|
| Numerical | Pressure = 25.4 | Regression |
| Categorical | Material = Steel | Classification |
| Time series | Temperature/hour | Forecasting |
| Text | Customer review | NLP |
| Image | X-ray / inspection image | Computer vision |
| Sensor | Vibration signal | Predictive maintenance |
Examples
Example 1: Calculating an Average
Suppose an engineer records five temperatures:
temperatures = [21, 23, 25, 24, 27]

average = sum(temperatures) / len(temperatures)

print(average)
The result provides a basic statistical summary.
Example 2: Using pandas
import pandas as pd

df = pd.DataFrame({
    "speed": [1000, 1200, 1400, 1600],
    "temperature": [40, 45, 51, 59]
})

print(df.describe())
This creates a structured dataset and generates descriptive statistics.
Example 3: Correlation
print(df.corr())
Correlation can help identify variables that move together.
⚠️ But correlation does not automatically prove causation.
Real-World Application
Predictive Maintenance
Industrial equipment produces enormous amounts of sensor information.
Data science can combine:
Temperature + vibration + pressure + operating time → Failure prediction
A predictive-maintenance system might warn engineers before a bearing, pump, turbine, or motor reaches a critical condition.
Energy Optimization
Data scientists can analyze energy consumption and determine when machines or buildings consume excessive electricity.
Machine-learning models can estimate future demand and help optimize operating schedules.
Structural Engineering
Engineers can combine sensor measurements with historical inspection data to identify unusual structural behavior.
Potential inputs include:
- Strain
- Displacement
- Acceleration
- Temperature
- Wind speed
Healthcare Engineering
Data science can support medical-image analysis, hospital resource planning, and predictive analytics while requiring careful attention to privacy, validation, and regulatory requirements.
Financial Engineering
Financial institutions use statistical models and machine learning for forecasting, risk analysis, fraud detection, and portfolio-related analytics.
Common Mistakes
Starting With Machine Learning
🚫 One of the biggest beginner mistakes is immediately trying to train sophisticated models.
A better progression is:
Python → Statistics → Data Cleaning → Visualization → Machine Learning
Ignoring Data Quality
A highly sophisticated algorithm cannot reliably compensate for severely flawed input data.
The principle is simple:
Poor data can produce poor decisions.
Using Too Many Libraries
Beginners sometimes install dozens of libraries before understanding the fundamentals.
Start with a focused toolkit:
- Python
- Jupyter
- NumPy
- pandas
- Matplotlib
- scikit-learn
Confusing Correlation With Causation
Two variables can be correlated without one causing the other.
Always investigate the underlying mechanism.
Evaluating Only Accuracy
A model with 99% accuracy may still be useless when the important event occurs only 1% of the time.
For imbalanced engineering problems, precision, recall, F1-score, and other metrics may be more informative.
Challenges & Solutions
Challenge: Missing Data
Solution: Determine why values are missing and choose an appropriate strategy such as imputation, removal, or model-based treatment.
Challenge: Large Datasets
Solution: Use efficient data structures, optimized queries, chunk processing, databases, and distributed computing when necessary.
Challenge: Overfitting
Overfitting occurs when a model learns training data too specifically and performs poorly on unseen observations.
Solution: Use:
- Train/test separation
- Cross-validation
- Regularization
- Feature selection
- Appropriate model complexity
Challenge: Difficult-to-Interpret Models
Complex models can be difficult to explain.
Solution: Use interpretable models when appropriate and apply explainability techniques where necessary.
Challenge: Changing Real-World Data
A model trained today may perform differently next year because operating conditions change.
Solution: Monitor model performance continuously and retrain when justified.
Case Study
Predicting Industrial Pump Failure
Imagine a water-treatment facility operating 100 industrial pumps.
Each pump produces:
- Temperature readings
- Vibration measurements
- Pressure readings
- Flow rate
- Operating hours
- Maintenance history
The engineering team wants to reduce unexpected failures.
Stage 1: Data Collection
Historical sensor readings are combined with maintenance records.
Stage 2: Data Cleaning
Incorrect sensor values are identified, duplicated records are removed, and missing observations are investigated.
Stage 3: Feature Engineering
The team creates additional variables such as:
Average vibration over 24 hours
Temperature increase over time
Operating hours since maintenance
Stage 4: Model Development
A classification model is trained using historical examples labeled as:
0 = No failure
1 = Failure
Stage 5: Evaluation
The team evaluates the model using precision, recall, F1-score, and a confusion matrix.
Stage 6: Deployment
When the model detects a high-risk condition, maintenance personnel receive an alert.
The objective is not merely to produce a high machine-learning score. The real objective is to reduce downtime, improve safety, and optimize maintenance resources.
Essential Tips
Build Projects
📌 Theory becomes much easier when connected to practical problems.
Good beginner projects include:
- House-price analysis
- Energy consumption prediction
- Weather-data analysis
- Student-performance analysis
- Industrial sensor analysis
- Customer segmentation
Learn Statistics
You do not need to become a theoretical mathematician, but understanding probability, distributions, correlation, regression, and uncertainty is extremely valuable.
Practice Data Cleaning
Real-world data science spends significant effort on data preparation.
Learning how to handle messy datasets is therefore more useful than memorizing dozens of algorithms.
Learn SQL
Python is powerful, but much professional data lives in relational databases.
SQL + Python is an extremely useful combination.
Understand the Engineering Problem
For engineering students and professionals, domain expertise can become a major advantage.
A data scientist who understands the physical system behind the data can often ask better questions and recognize unrealistic results.
Document Your Work
Keep track of:
- Dataset versions
- Assumptions
- Feature definitions
- Model parameters
- Evaluation results
- Software versions
This improves reproducibility and professional quality.
FAQs
What are the main elements of data science?
The major elements include data collection, data cleaning, statistics, exploratory analysis, visualization, feature engineering, machine learning, model evaluation, and deployment.
Is Python difficult for beginners?
Python is generally considered beginner-friendly because its syntax is relatively readable. However, becoming proficient in professional data science requires consistent practice.
Do I need advanced mathematics to learn data science?
Not at the beginning. Basic algebra, statistics, probability, and logical reasoning provide a strong foundation. More advanced machine learning and research applications may require deeper mathematics.
Which Python libraries should I learn first?
A practical starting set is NumPy, pandas, Matplotlib, and scikit-learn. Jupyter is also useful for interactive experimentation.
Is data science useful for engineers?
Yes. Data science can support predictive maintenance, process optimization, quality control, energy analysis, simulation, monitoring, forecasting, and intelligent automation.
Should I learn Python or machine learning first?
Learn basic Python first. Once you can work comfortably with variables, functions, loops, data structures, files, and libraries, move into data analysis and then machine learning.
What is the difference between data science and machine learning?
Data science is the broader discipline. Machine learning is one component of data science that focuses on algorithms capable of learning patterns from data.
Can data science guarantee accurate predictions?
No. Predictions always contain uncertainty. Model quality depends on data quality, assumptions, feature selection, model choice, validation, and changes in the real-world system.
Conclusion
🚀 Data science is not simply about writing Python code or training machine-learning models. It is a complete problem-solving discipline that combines data, statistics, programming, visualization, computational methods, and domain expertise.
For beginners, the best route is gradual:
Python → Data Structures → NumPy/pandas → Statistics → Visualization → Machine Learning → Real Projects
For engineering professionals, the next level is learning how to integrate these techniques into actual systems involving sensors, databases, simulations, optimization, forecasting, and decision-making.
The most important principle is to start with the problem, not the algorithm. Once the engineering question is clearly defined, Python provides an exceptionally flexible environment for collecting, transforming, analyzing, visualizing, and modeling data.
Whether your goal is predictive maintenance, energy optimization, financial analytics, scientific computing, artificial intelligence, or engineering automation, understanding the fundamental elements of data science gives you a powerful foundation for building practical and intelligent solutions. 🐍📊⚙️🤖




