
Data Analysis Foundations with Python: Analyzing Customer Reviews, Predicting House Prices, and Building a Recommender System 🐍📊🏠
Introduction: Why Python Data Analysis Matters 🚀
Data is one of the most valuable engineering resources in the modern digital economy. Companies collect information from websites, mobile applications, sensors, transactions, customer feedback, property listings, and countless other sources. However, raw data has limited value until it is transformed into useful information.
Python has become one of the most practical programming languages for this transformation because it combines readable syntax with a powerful ecosystem for data processing, visualization, statistics, and machine learning.
A beginner can use Python to load a spreadsheet and calculate basic statistics, while an experienced professional can develop sophisticated predictive systems using the same programming environment.
This article explores three practical examples that demonstrate the foundations of data analysis:
- 📝 Analyzing customer reviews
- 🏠 Predicting house prices
- 🤖 Building a recommender system
Together, these applications demonstrate an important engineering workflow:
Raw Data → Cleaning → Exploration → Analysis → Modeling → Evaluation → Decision


The goal is not simply to learn Python commands. The real objective is to understand how engineers turn imperfect data into reliable conclusions and useful systems.
Background Theory 📚
Data analysis is the process of examining datasets to discover patterns, relationships, trends, anomalies, and useful information.
In engineering applications, data analysis commonly involves several stages.
Understanding the Data Lifecycle
A typical project begins with data collection. Information might arrive as CSV files, databases, APIs, spreadsheets, logs, or cloud storage.
The next stage is data preparation.
Real-world datasets are rarely perfect. They may contain:
- Missing values
- Duplicate records
- Incorrect formats
- Inconsistent labels
- Outliers
- Typographical errors
- Irrelevant columns
- Biased observations
After preparation, engineers explore the dataset using statistical summaries and visualizations.
The final stages may involve predictive modeling, classification, recommendation, or automated decision-making.
Descriptive, Diagnostic, Predictive, and Prescriptive Analysis
Data analysis can be divided into several useful categories.
Descriptive analysis answers:
What happened?
For example, which products received the highest number of reviews?
Diagnostic analysis asks:
Why did it happen?
For example, why did customer satisfaction decrease?
Predictive analysis asks:
What might happen next?
House price prediction is an example.
Prescriptive analysis asks:
What should we do?
A recommender system can support this type of decision by suggesting products, movies, books, or services.
Definition: Data Analysis Foundations with Python 🔎
Data analysis with Python is the systematic process of collecting, cleaning, transforming, exploring, visualizing, and interpreting data using Python and its supporting libraries.
Important Python libraries include:
| Library | Main Purpose |
|---|---|
| NumPy | Numerical computing |
| pandas | Data manipulation |
| Matplotlib | Data visualization |
| Seaborn | Statistical visualization |
| scikit-learn | Machine learning |
| SciPy | Scientific computing |
| Jupyter | Interactive analysis |
Python is particularly useful because these tools can be combined into a single workflow.
The Core Engineering Pipeline
A practical Python data-analysis pipeline usually follows this structure:
1. Collect → 2. Inspect → 3. Clean → 4. Explore → 5. Visualize → 6. Model → 7. Evaluate → 8. Communicate
Skipping one of these stages can create problems later.
For example, training a sophisticated machine-learning model on incorrectly formatted data does not produce a reliable solution.
Step-by-Step Explanation: From Raw Data to Useful Information 🛠️


Step 1: Define the Engineering Question
Before writing Python code, determine what you want to discover.
For customer reviews:
What factors influence customer satisfaction?
For house prices:
Which property characteristics are associated with higher prices?
For recommendations:
Which products should be suggested to a particular user?
A clear question prevents unnecessary analysis.
Step 2: Collect the Dataset
Data can come from many sources.
Examples include:
- CSV files
- SQL databases
- Public datasets
- Company databases
- APIs
- Website-generated records
- IoT devices
The source should be documented because data quality depends heavily on how information was collected.
Step 3: Load and Inspect the Data
A common starting point is pandas.
import pandas as pd

data = pd.read_csv("customer_reviews.csv")

print(data.head())
print(data.info())
print(data.describe())
These commands provide an initial understanding of the dataset.
Step 4: Clean the Dataset
Cleaning may involve removing duplicates, correcting formats, handling missing values, and standardizing categories.
For example:
data = data.drop_duplicates()
data["rating"] = data["rating"].fillna(data["rating"].median())
The appropriate strategy depends on the meaning of the missing information.
Step 5: Explore Patterns
Visualization makes patterns easier to identify.
import matplotlib.pyplot as plt

data["rating"].value_counts().sort_index().plot(kind="bar")

plt.title("Customer Rating Distribution")
plt.xlabel("Rating")
plt.ylabel("Number of Reviews")
plt.show()
Charts can reveal trends that are difficult to detect from tables alone.
Step 6: Build a Model When Appropriate
Not every dataset requires machine learning.
If the objective is simply to understand customer ratings, descriptive analysis may be sufficient.
However, if the objective is to predict prices or recommend products, machine learning can become useful.
Step 7: Evaluate the Result
A model should never be judged solely by whether it produces predictions.
Engineers need to examine:
- Accuracy
- Error
- Generalization
- Bias
- Stability
- Data leakage
- Business usefulness
Step 8: Communicate the Findings
A technically excellent analysis can still fail if nobody understands the result.
Good data communication combines:
Charts + Explanation + Context + Action
Comparing Three Practical Python Applications ⚖️
The three examples demonstrate different analytical goals.
| Application | Main Goal | Typical Data | Output |
|---|---|---|---|
| Customer Reviews | Understand opinions | Text + ratings | Sentiment and trends |
| House Prices | Predict values | Property features | Price prediction |
| Recommender System | Personalize choices | User-item interactions | Recommendations |
Customer Review Analysis
Customer review analysis focuses heavily on text.
Engineers may examine:
- Ratings
- Review length
- Keywords
- Positive language
- Negative language
- Product categories
- Customer complaints
Natural language processing can transform text into measurable features.
House Price Prediction
House price prediction generally uses structured information.
Typical features include:
- Location
- Property size
- Number of rooms
- Number of bathrooms
- Building age
- Property type
- Parking
- Local amenities
The model learns relationships between these features and historical prices.
Recommender Systems
Recommender systems focus on user behavior.
The system may examine:
- Purchases
- Ratings
- Clicks
- Search activity
- Viewing history
- Favorites
- Time spent on content
It then identifies useful patterns for future recommendations.
Diagrams and Data Structures 📊

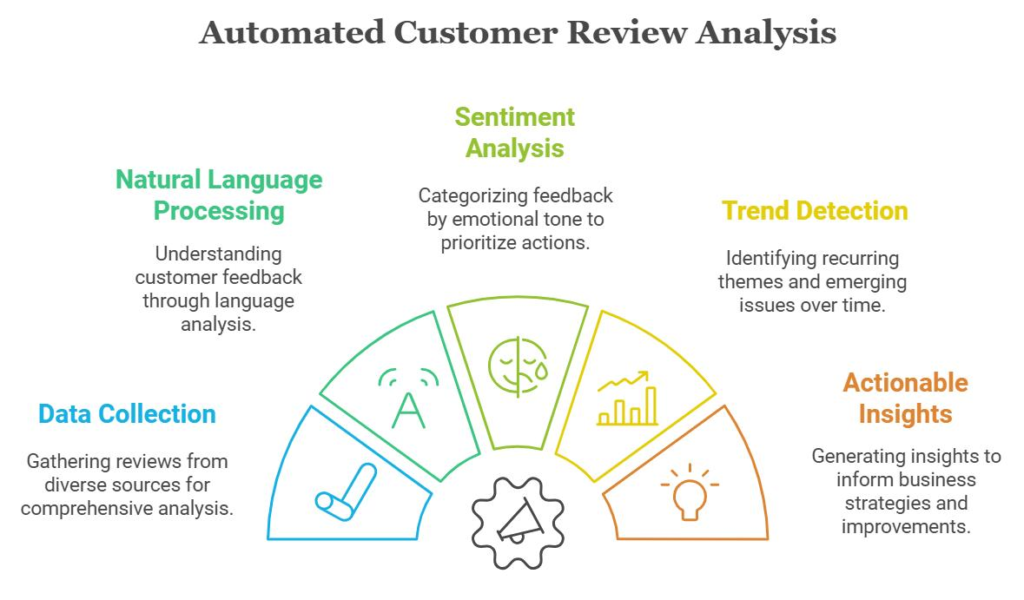


Customer Review Analysis Structure
A simplified data structure might look like this:
| Customer | Product | Rating | Review |
|---|---|---|---|
| C001 | Laptop A | 5 | Excellent performance |
| C002 | Laptop A | 2 | Battery life is poor |
| C003 | Laptop B | 4 | Good value |
The analyst can combine numerical and textual information.
House Price Dataset
| Property | Area | Rooms | Location | Condition | Price |
|---|---|---|---|---|---|
| A | Large | 4 | Urban | Good | High |
| B | Medium | 3 | Suburban | Excellent | Medium |
| C | Small | 2 | Rural | Good | Lower |
The actual values would normally be numerical and standardized before modeling.
Recommender-System Structure
A recommendation dataset might contain:
| User | Item | Interaction |
|---|---|---|
| U001 | Book A | Purchased |
| U001 | Book B | Viewed |
| U002 | Book A | Rated highly |
| U003 | Book C | Purchased |
The system searches for meaningful patterns among these interactions.
Examples Without Equations 💡
Example 1: Customer Reviews
Imagine an online electronics store receives 50,000 customer reviews.
The company discovers that many negative reviews mention:
- Battery
- Delivery
- Packaging
- Customer support
Instead of reading every review manually, an automated Python workflow can categorize reviews and identify recurring issues.
The engineering team can then prioritize battery improvements and delivery processes.
Example 2: House Prices
A property company has historical records for thousands of homes.
After analyzing the dataset, Python reveals that location, floor area, property condition, and accessibility are particularly important.
A prediction model can then estimate likely prices for newly listed properties.
The prediction should be treated as a decision-support tool rather than an unquestionable valuation.
Example 3: Recommender System
Suppose a visitor reads several articles about artificial intelligence and Python.
A recommendation system can identify other users with similar interests and recommend related engineering articles.
This can improve:
- User engagement
- Content discovery
- Session duration
- Customer experience
Real-World Applications 🌍

E-Commerce
Online retailers analyze reviews and purchasing behavior to understand customers and personalize product suggestions.
Real Estate
Property companies use predictive analytics to estimate prices, identify market trends, and evaluate investment opportunities.
Healthcare Engineering
Data analysis can help researchers examine operational datasets, equipment information, and research observations. Sensitive healthcare applications require strong privacy, security, and governance controls.
Banking and Finance
Financial organizations use data analysis for forecasting, risk assessment, fraud detection, and customer segmentation.
Manufacturing
Engineers can analyze machine data to identify abnormal behavior and support predictive maintenance.
Education
Educational platforms can analyze learner behavior to personalize content and identify areas where students may need additional support.
Common Mistakes ⚠️
Using Dirty Data
A sophisticated model cannot compensate for fundamentally poor-quality data.
Solution: Always inspect and clean the dataset before modeling.
Ignoring Missing Values
Simply deleting every row containing missing information may remove valuable observations.
Solution: Investigate why values are missing before selecting a treatment.
Data Leakage
Data leakage occurs when information that would not realistically be available at prediction time accidentally enters the training process.
This can make a model appear extremely accurate during testing while performing poorly in production.
Overfitting
A model can memorize training examples rather than learning general patterns.
Solution: Use appropriate validation techniques and compare training performance with unseen data.
Confusing Correlation With Causation
If two variables move together, that does not automatically mean one causes the other.
Using Too Many Features
Adding every available variable does not necessarily improve a model.
Some features may be irrelevant, unstable, or harmful.
Challenges and Solutions 🔧
| Challenge | Problem | Practical Solution |
|---|---|---|
| Missing data | Incomplete observations | Investigate and handle appropriately |
| Large datasets | Slow processing | Optimize operations and data types |
| Text complexity | Difficult interpretation | Use NLP techniques |
| Biased data | Unfair conclusions | Audit sampling and outputs |
| Overfitting | Poor generalization | Validation and regularization |
| Poor visualization | Difficult communication | Use clear charts |
| Model drift | Performance changes | Monitor production data |
Handling Changing Data
A model trained on historical data may become less effective as customer preferences or property markets change.
Continuous monitoring is therefore important.
Improving Recommender Systems
Recommendation quality can suffer when new users or new products have little historical information.
This is commonly known as the cold-start problem.
Possible solutions include:
- Popular-item recommendations
- Content-based information
- Initial preference questions
- Hybrid recommendation methods
Case Study: A Python-Powered Digital Book Platform 📚🐍
Consider a hypothetical engineering education website containing thousands of technical articles and books.
The platform wants to improve user experience.
Phase 1: Analyze User Feedback
The team collects reviews and feedback.
Python identifies frequent themes such as:
- Technical depth
- Download experience
- Search quality
- Topic relevance
- Content organization
The team visualizes these categories to identify the most common complaints.
Phase 2: Analyze Content Performance
The engineering team examines which topics attract the most engagement.
Python can group content by categories such as:
- Python
- Artificial Intelligence
- Data Science
- Civil Engineering
- Electrical Engineering
- Mechanical Engineering
The results can reveal which areas deserve additional content.
Phase 3: Build Recommendations
The platform records anonymous interaction patterns such as article views and content categories.
A recommendation engine can suggest related resources.
For example:
Python → Data Analysis → Machine Learning → Predictive Modeling
A visitor reading about Python data analysis may therefore receive relevant machine-learning content.
Phase 4: Evaluate the System
The team measures whether recommendations improve meaningful engagement.
Useful indicators might include:
- Recommendation clicks
- Content completion
- Returning visitors
- Search behavior
- Session quality
The important lesson is that machine learning is only one part of the solution.
Data quality + engineering design + evaluation = useful system.
Essential Tips for Beginners and Professionals ⭐
Start With Simple Analysis
Do not immediately jump into deep learning.
First understand:
- pandas
- data cleaning
- filtering
- grouping
- visualization
- descriptive statistics
Learn to Ask Better Questions
The quality of analysis depends heavily on the quality of the question.
Instead of asking:
What does this dataset contain?
Ask:
Which factors appear most strongly associated with customer dissatisfaction?
Visualize Before Modeling
A simple chart can expose unusual values, missing patterns, or incorrect assumptions before machine learning begins.
Keep Data Preparation Reproducible
Use Python scripts or notebooks to document transformations rather than manually modifying datasets.
Separate Training and Testing Data
Predictive models should be evaluated on data they did not use during training.
Document Assumptions
Record decisions about:
- Missing values
- Feature selection
- Outliers
- Data sources
- Model choices
- Evaluation methods
Think Like an Engineer
A model with excellent laboratory performance may still be useless if it is:
- Too expensive
- Too slow
- Difficult to maintain
- Impossible to explain
- Dependent on unavailable data
Engineering means considering the entire system.
Frequently Asked Questions ❓
What is Python data analysis?
Python data analysis is the process of using Python libraries and programming techniques to clean, explore, visualize, interpret, and model datasets.
Is Python difficult for beginners?
Python is considered relatively approachable because its syntax is readable. Beginners can start with basic pandas operations and gradually progress toward statistics and machine learning.
Which Python library should I learn first?
For general data analysis, pandas is an excellent starting point. It should ideally be combined with basic NumPy and visualization knowledge.
Can Python predict house prices accurately?
Python can build useful house-price prediction models, but accuracy depends on data quality, feature selection, market conditions, geographic coverage, and model design. Predictions should not automatically be treated as professional property valuations.
How does a recommender system work?
A recommender system analyzes relationships between users, items, and interactions to identify content or products that may be relevant to a particular user.
Do I need machine learning for customer reviews?
Not always. Basic statistics, keyword analysis, grouping, and visualization may answer many questions. Machine learning becomes useful when the task requires automated classification, sentiment detection, or large-scale prediction.
What is the most important skill in data analysis?
Beyond programming syntax, problem formulation and critical thinking are extremely important. An analyst must understand what the data represents and whether the conclusions are actually justified.
Can the same Python workflow be used for different industries?
Yes. The general workflow—collect, clean, explore, model, evaluate, and communicate—can be adapted to engineering, finance, retail, education, manufacturing, real estate, and many other fields.
Conclusion 🎯
Data analysis is much more than creating charts or running Python commands. It is an engineering discipline for transforming raw information into reliable knowledge and practical decisions.
Customer-review analysis demonstrates how Python can convert large amounts of textual feedback into measurable insights. House-price prediction demonstrates how historical structured data can support forecasting. Recommender systems demonstrate how user behavior can be transformed into personalized experiences.
The three applications share the same foundation:
📥 Data → 🧹 Cleaning → 🔍 Exploration → 📊 Visualization → 🤖 Modeling → ✅ Evaluation → 🚀 Deployment
For students, these projects provide an excellent path from basic Python programming toward practical data science.
For professionals, they demonstrate how analytical workflows can become production systems that support real business and engineering decisions.
The most valuable lesson is simple:
Good data analysis is not about making the most complicated model. It is about asking the right question, using reliable data, choosing an appropriate method, and communicating the result clearly.
With Python as the foundation, learners can progress from simple datasets to sophisticated analytical systems while developing skills that apply across the USA, UK, Canada, Australia, Europe, and the wider global engineering community. 🐍📊🌍




