Applied Univariate, Bivariate, and Multivariate Statistics: A Complete Engineering Guide for Data Analysis, Modeling, and Decision-Making 📊⚙️
Introduction 🚀
Statistics has become one of the most important tools in modern engineering. Whether engineers are designing aircraft, optimizing manufacturing processes, analyzing sensor data, improving energy systems, or developing artificial intelligence applications, statistical methods provide the foundation for informed decision-making.
In today’s data-driven engineering environment, massive amounts of information are generated every second. Sensors, machines, software systems, and industrial processes continuously produce data that must be analyzed effectively. Without statistical analysis, this data remains merely a collection of numbers with little practical value.
Applied statistics can generally be categorized into three major branches:
- Univariate Statistics 📈
- Bivariate Statistics 🔄
- Multivariate Statistics 🌐
Each branch serves a unique purpose and addresses different analytical questions. Understanding when and how to use each statistical approach is essential for engineers, researchers, scientists, and data professionals.
This comprehensive guide explores the theory, applications, methods, examples, and engineering significance of univariate, bivariate, and multivariate statistics.
Background Theory 📚
Statistics emerged from the need to understand patterns, variability, and uncertainty within data.
Engineering systems rarely behave perfectly due to:
- Material variations
- Environmental changes
- Manufacturing tolerances
- Human factors
- Measurement errors
- Random disturbances
Statistics provides mathematical techniques to:
✅ Describe data
✅ Identify patterns
📈 Detect anomalies
✅ Predict outcomes
✅ Support engineering decisions
Historically, statistical methods evolved from probability theory and became fundamental in:
- Quality control
- Reliability engineering
- Industrial engineering
- Mechanical engineering
- Electrical engineering
- Civil engineering
- Chemical engineering
- Data science
As datasets grew larger and more complex, statistical analysis expanded from single-variable investigations to sophisticated multivariable modeling techniques.
Technical Definition ⚙️
Univariate Statistics
Univariate statistics involve the analysis of a single variable.
The primary goal is to describe and summarize the characteristics of that variable.
Examples:
- Temperature readings
- Machine vibration levels
- Product weight
- Battery voltage
Questions answered:
- What is the average?
- How spread out is the data?
- What is the distribution shape?
Bivariate Statistics
Bivariate statistics examine the relationship between two variables.
Examples:
- Pressure vs temperature
- Load vs deformation
- Speed vs fuel consumption
Questions answered:
- Are the variables related?
- How strong is the relationship?
- Can one variable predict another?
Multivariate Statistics
Multivariate statistics analyze three or more variables simultaneously.
Examples:
- Temperature, pressure, and flow rate
- Material strength, density, and hardness
- Multiple sensor measurements
Questions answered:
- How do variables interact?
- Which variables are most important?
- Can complex systems be modeled accurately?
Understanding Univariate Statistics 📊
Purpose of Univariate Analysis
Univariate analysis focuses on understanding one variable at a time.
Engineers use it to:
- Summarize datasets
- Detect outliers
- Understand distributions
- Evaluate process performance
Measures of Central Tendency
Mean
The arithmetic average.
xˉ=1/n∑i=1nxi
Useful when data is normally distributed.
Median
The middle value after sorting data.
Advantages:
- Resistant to outliers
- Effective for skewed distributions
Mode
Most frequently occurring value.
Useful for:
- Quality control
- Manufacturing inspection
- Categorical data
Measures of Dispersion
Range
Difference between maximum and minimum values.
Variance
Measures spread around the mean.
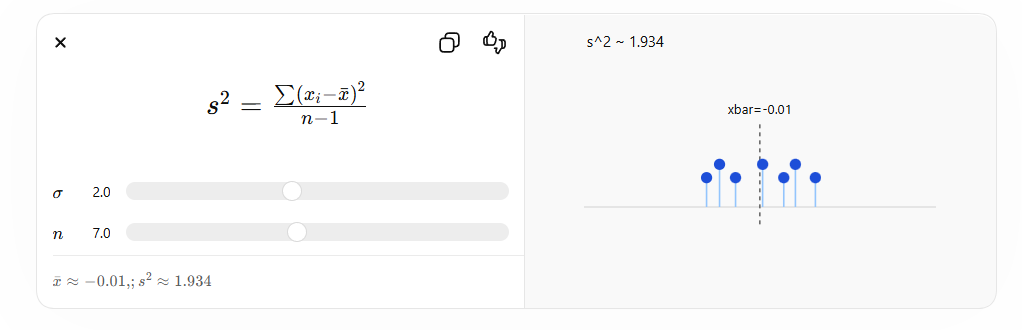
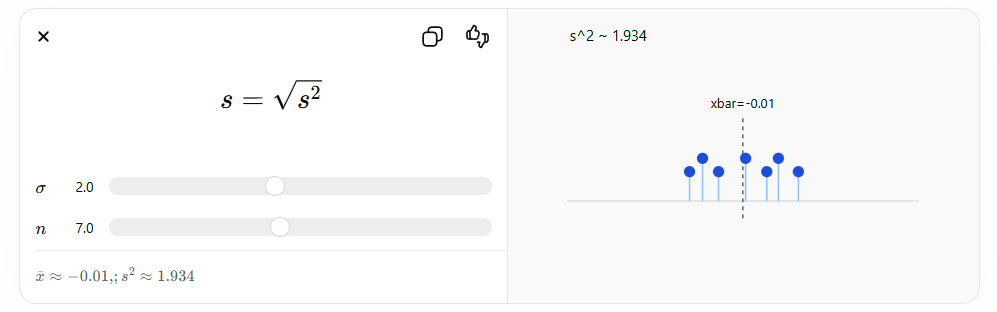
Standard Deviation
Most common measure of variability.
Distribution Shape
Engineers frequently analyze:
- Normal Distribution 🔔
- Uniform Distribution 📏
- Exponential Distribution ⚡
- Weibull Distribution 🏭
Understanding distribution shape helps engineers select appropriate models.
Understanding Bivariate Statistics 🔄
Purpose of Bivariate Analysis
Bivariate statistics study relationships between two variables.
For example:
| Variable 1 | Variable 2 |
|---|---|
| Temperature | Pressure |
| Speed | Fuel Consumption |
| Voltage | Current |
| Load | Deflection |
Correlation Analysis
Correlation measures relationship strength.
Pearson Correlation Coefficient
r=∑(xi−xˉ)(yi−yˉ)/∑(xi−xˉ)2∑(yi−yˉ)2
Interpretation:
| Value | Meaning |
|---|---|
| +1 | Perfect Positive |
| 0 | No Relationship |
| -1 | Perfect Negative |
Scatter Plots
Scatter plots visually display relationships.
Example:
| Temperature | Pressure |
|---|---|
| 20 | 100 |
| 25 | 120 |
| 30 | 145 |
| 35 | 170 |
A positive trend suggests correlation.
Linear Regression
Regression predicts one variable using another.
General equation:
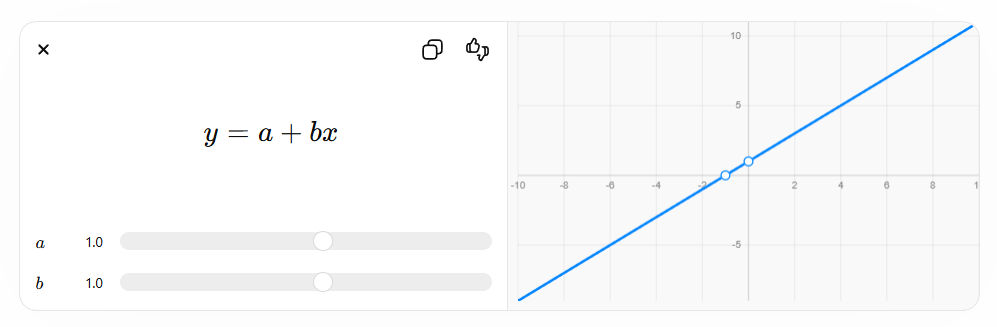
Where:
- y = dependent variable
- x = independent variable
- a = intercept
- b = slope
Applications include:
- Predictive maintenance
- Performance forecasting
- Process optimization
Understanding Multivariate Statistics 🌐
Why Multivariate Analysis Matters
Real engineering systems involve many variables simultaneously.
Examples:
An engine’s performance may depend on:
- Fuel flow
- Air intake
- Temperature
- Pressure
- RPM
Studying variables individually may miss critical interactions.
Key Multivariate Techniques
Multiple Linear Regression
Predicts one variable using multiple predictors.
Y=β0+β1X1+β2X2+⋯+βnXn
Applications:
- Manufacturing optimization
- Energy forecasting
- Structural analysis
Principal Component Analysis (PCA)
PCA reduces data dimensions.
Benefits:
✅ Simplifies datasets
📈 Removes redundancy
✅ Improves visualization
✅ Enhances machine learning
Cluster Analysis
Groups similar observations.
Engineering uses:
- Fault detection
- Pattern recognition
- Customer segmentation
- Predictive maintenance
Discriminant Analysis
Classifies observations into predefined groups.
Applications:
- Product quality classification
- Defect detection
- Medical engineering systems
Step-by-Step Statistical Analysis Process 🛠️
Step 1: Define the Engineering Problem
Examples:
- Reduce machine failures
- Improve product quality
- Predict energy consumption
Clear objectives guide analysis.
Step 2: Collect Data
Sources include:
- Sensors
- Experiments
- Simulations
- Historical databases
Ensure:
✅ Accuracy
📈 Consistency
✅ Completeness
Step 3: Clean Data
Remove:
- Missing values
- Duplicates
- Measurement errors
Poor data quality leads to poor conclusions.
Step 4: Perform Univariate Analysis
Examine:
- Mean
- Median
- Variance
- Histograms
Understand each variable individually.
Step 5: Conduct Bivariate Analysis
Evaluate:
- Correlations
- Scatter plots
- Regression models
Identify relationships.
Step 6: Apply Multivariate Techniques
Investigate:
- Interactions
- Hidden patterns
- Predictive models
This stage often reveals the most valuable insights.
Step 7: Interpret Results
Engineers should translate statistics into practical actions.
Example:
Instead of saying:
“Variable X significantly influences Y.”
Say:
“Reducing pressure variation by 10% may improve production efficiency by 5%.”
Comparison of Univariate, Bivariate, and Multivariate Statistics ⚖️
| Feature | Univariate | Bivariate | Multivariate |
|---|---|---|---|
| Variables Analyzed | 1 | 2 | 3+ |
| Complexity | Low | Medium | High |
| Main Purpose | Description | Relationship | System Modeling |
| Visualization | Histogram | Scatter Plot | PCA Plots |
| Engineering Use | Process Monitoring | Correlation Study | Optimization |
| Computational Demand | Low | Moderate | High |
| Predictive Capability | Limited | Moderate | Strong |
Visual Diagram of Statistical Progression 📈
Raw Data
   │
   ▼
Univariate Analysis
   │
   ▼
Bivariate Analysis
   │
   ▼
Multivariate Analysis
   │
   ▼
Engineering Decisions
Practical Engineering Examples 🔬
Example 1: Manufacturing Quality Control
Variable:
Product Diameter
Univariate analysis reveals:
- Mean diameter
- Standard deviation
- Process stability
Result:
Engineers identify tolerance violations.
Example 2: Heat Exchanger Performance
Variables:
- Temperature
- Pressure
Bivariate analysis reveals:
- Positive correlation
- Predictive relationship
Result:
Improved operational control.
Example 3: Smart Factory Monitoring
Variables:
- Vibration
- Temperature
- Current
- Speed
- Load
Multivariate analysis identifies:
- Failure patterns
- Maintenance requirements
Result:
Reduced downtime.
Real-World Applications 🌍
Mechanical Engineering
Applications:
- Fatigue analysis
- Reliability assessment
- Vibration monitoring
Electrical Engineering
Applications:
- Signal processing
- Fault diagnosis
- Power system optimization
Civil Engineering
Applications:
- Structural health monitoring
- Traffic modeling
- Material testing
Chemical Engineering
Applications:
- Process optimization
- Yield prediction
- Reactor control
Aerospace Engineering
Applications:
- Flight performance analysis
- Risk assessment
- Sensor fusion
Industrial Engineering
Applications:
- Quality management
- Lean manufacturing
- Productivity analysis
Common Mistakes ❌
Ignoring Outliers
Outliers may indicate:
- Measurement errors
- Equipment failures
- Process abnormalities
Always investigate before removal.
Confusing Correlation with Causation
Strong correlation does not necessarily imply cause-and-effect.
Example:
Ice cream sales and drowning incidents may increase together because both are influenced by summer temperatures.
Using Small Samples
Insufficient data can produce unreliable conclusions.
Engineers should collect adequate samples.
Overfitting Models
Complex multivariate models may fit historical data perfectly but perform poorly on new data.
Always validate models.
Ignoring Assumptions
Many statistical methods assume:
- Independence
- Normality
- Constant variance
Violations can invalidate results.
Challenges and Solutions 🧩
Challenge 1: Missing Data
Problem:
Incomplete observations.
Solution:
- Data imputation
- Sensor redundancy
- Improved collection methods
Challenge 2: High-Dimensional Data
Problem:
Too many variables.
Solution:
- PCA
- Feature selection
- Dimensionality reduction
Challenge 3: Noisy Measurements
Problem:
Sensor inaccuracies.
Solution:
- Filtering
- Calibration
- Statistical smoothing
Challenge 4: Computational Complexity
Problem:
Large datasets require significant processing power.
Solution:
- Cloud computing
- Parallel processing
- Efficient algorithms
Engineering Case Study 🏭
Predictive Maintenance in a Manufacturing Plant
A factory experienced unexpected machine failures causing production losses.
Data collected:
- Temperature
- Vibration
- Motor current
- Rotation speed
- Maintenance records
Stage 1: Univariate Analysis
Engineers examined each sensor separately.
Finding:
Temperature occasionally exceeded safe limits.
Stage 2: Bivariate Analysis
Temperature versus vibration showed moderate correlation.
Finding:
Higher temperatures often accompanied increased vibration.
Stage 3: Multivariate Analysis
Multiple regression and PCA were applied.
Finding:
A combination of temperature, vibration, and current predicted failures with high accuracy.
Results
Benefits achieved:
✅ 30% reduction in downtime
📈 20% maintenance cost reduction
✅ Improved production efficiency
✅ Enhanced equipment reliability
This demonstrates the practical value of combining univariate, bivariate, and multivariate statistical approaches.
Tips for Engineers 💡
Focus on Problem Definition
Statistics cannot compensate for poorly defined objectives.
Visualize Data Early
Charts often reveal patterns before formal analysis.
Understand Data Sources
Know how measurements are obtained.
Verify Statistical Assumptions
Check assumptions before applying advanced methods.
Combine Domain Knowledge with Statistics
Engineering expertise is just as important as mathematical analysis.
Automate Repetitive Analysis
Use tools such as:
- Python
- MATLAB
- R
- Minitab
- SPSS
Automation increases consistency and efficiency.
Document Findings Clearly
Decision-makers need understandable conclusions, not just equations.
Frequently Asked Questions (FAQs) ❓
What is the difference between univariate and bivariate statistics?
Univariate statistics analyze one variable, while bivariate statistics examine relationships between two variables.
Why is multivariate analysis important in engineering?
Most engineering systems involve many interacting variables. Multivariate analysis captures these interactions and improves prediction accuracy.
When should engineers use regression analysis?
Regression is useful when predicting one variable from one or more explanatory variables.
What software is commonly used for statistical engineering analysis?
Popular tools include Python, MATLAB, R, SPSS, Minitab, SAS, and Excel.
Is correlation enough to prove causation?
No. Correlation only indicates association. Additional experiments and engineering reasoning are needed to establish causation.
What is PCA used for?
Principal Component Analysis reduces data dimensionality while preserving important information.
How much data is needed for reliable analysis?
The required sample size depends on variability, confidence level, and analysis type. Larger datasets generally provide more reliable conclusions.
Can machine learning replace statistics?
Machine learning builds upon statistical principles. Engineers still need statistical knowledge to understand, validate, and interpret machine learning models.
Conclusion 🎯
Applied univariate, bivariate, and multivariate statistics form the backbone of modern engineering analysis. From simple descriptive summaries to advanced predictive models, these techniques enable engineers to transform raw data into actionable knowledge.
Univariate statistics help engineers understand individual variables. Bivariate statistics reveal relationships between pairs of variables. Multivariate statistics uncover complex interactions within entire systems. Together, they provide a powerful framework for solving engineering problems, improving quality, reducing costs, increasing reliability, and driving innovation.
As industries continue embracing automation, artificial intelligence, digital twins, Industry 4.0, and smart manufacturing, the importance of statistical analysis will only continue to grow. Engineers who master these statistical tools gain a significant advantage in designing smarter systems, making better decisions, and creating more efficient solutions for the challenges of the future. 🚀📊⚙️🌍


