
An Introduction to Statistical Learning with Applications in Python: A Practical Guide for Students and Engineers
Introduction
Statistical learning is one of the most important foundations of modern data science, machine learning, artificial intelligence, and engineering analytics. It provides a structured way to discover patterns in data, understand relationships between variables, make predictions, and support technical decisions.
For engineers and students, statistical learning is especially valuable because engineering problems often generate large amounts of data. Sensors, experiments, simulations, production systems, websites, financial systems, and scientific instruments can all produce datasets that require systematic analysis.
Python has become a powerful environment for statistical learning because it connects programming, statistics, visualization, and machine learning in one ecosystem. Libraries such as NumPy, pandas, Matplotlib, Seaborn, SciPy, and scikit-learn allow beginners to start with simple data analysis and gradually move toward sophisticated predictive models.


The key idea is simple:
Data → Understanding → Model → Evaluation → Decision 🔍📊🤖
Statistical learning does not mean blindly applying an algorithm. The engineer must first understand the data, identify the problem, select appropriate variables, choose a suitable model, validate its performance, and interpret the results.
This article introduces the major ideas behind statistical learning and explains how they can be applied using Python—from beginner-level concepts to professional engineering workflows.
Background Theory
From Statistics to Statistical Learning
Traditional statistics is strongly concerned with understanding populations, estimating quantities, testing hypotheses, and measuring uncertainty.
Statistical learning expands this perspective by emphasizing the ability to learn useful relationships from observed data.
A statistical learning problem usually contains:
- Observations — individual records or measurements.
- Features — variables describing each observation.
- Response or target — the quantity we want to understand or predict.
- Model — a representation of the relationship between inputs and output.
- Training data — data used to develop the model.
- Testing data — unseen data used to evaluate it.
For example, an engineer might collect measurements from a manufacturing machine. Features could include temperature, vibration, operating speed, pressure, and load. The target could be whether the machine requires maintenance.
Statistical learning attempts to discover a useful relationship between these variables.
Learning From Data
There are two major perspectives.
Supervised learning uses known target values. The model learns from examples where the correct outcome is already available.
Typical supervised learning problems include:
- Predicting energy consumption.
- Estimating house prices.
- Detecting equipment failures.
- Classifying emails.
- Predicting customer demand.
Unsupervised learning works without a predefined target. The goal is to discover hidden structures or groups.
Examples include:
- Customer segmentation.
- Grouping machines according to operating behavior.
- Detecting unusual observations.
- Reducing the number of variables.
Why Model Validation Matters
A model that performs extremely well on its training data may still perform poorly on new observations.
This is known as overfitting.
A useful statistical learning workflow therefore separates development data from evaluation data. Cross-validation can also provide a more reliable estimate of how a model will behave on unseen observations.
The objective is not simply to create a model that memorizes historical data.
🎯 The objective is to create a model that generalizes.
Definition
What Is Statistical Learning?
Statistical learning is the process of using statistical methods, computational techniques, and data-driven models to discover relationships within data and use those relationships for explanation, prediction, classification, or decision-making.
It sits at the intersection of:
Statistics + Programming + Data Analysis + Machine Learning + Domain Knowledge
Statistical learning can therefore be viewed as a bridge between traditional statistical analysis and modern machine learning.
Statistical Learning in Python
Python provides a practical environment for implementing the complete workflow.
| Python Tool | Primary Purpose |
|---|---|
| NumPy | Numerical computing |
| pandas | Data manipulation |
| Matplotlib | Visualization |
| Seaborn | Statistical visualization |
| SciPy | Scientific and statistical computing |
| scikit-learn | Machine learning |
| statsmodels | Statistical modeling and inference |
| Jupyter | Interactive analysis |
The important point is that these tools should work together rather than being treated as isolated technologies.
Step-by-Step Statistical Learning Workflow
Step 1: Define the Engineering Problem
Start with the question—not the algorithm.
Instead of asking:
“Which machine learning model should I use?”
ask:
“What decision or prediction am I trying to improve?”
For example:
Problem: Predict whether an industrial pump will require maintenance during the next operating period.
Possible inputs include:
- Temperature
- Pressure
- Vibration
- Operating hours
- Flow rate
- Motor load
The target could be a maintenance event.
Step 2: Collect and Understand the Data
The next stage is obtaining reliable data.
Data may come from:
- Sensors
- Databases
- CSV files
- Laboratory experiments
- Manufacturing systems
- Public datasets
- APIs
- Simulation software
After loading the data into pandas, inspect its structure.
Important questions include:
- How many observations exist?
- Which variables are numerical?
- Which variables are categorical?
- Are values missing?
- Are there suspicious measurements?
- Are duplicate records present?
- Are units consistent?


Step 3: Perform Exploratory Data Analysis
Exploratory Data Analysis, or EDA, is where the engineer begins understanding the dataset.
Useful visualizations include:
- Histograms
- Scatter plots
- Box plots
- Line charts
- Bar charts
- Correlation heatmaps
A histogram can reveal unusual distributions. A scatter plot can expose relationships between two variables. A box plot can reveal potential outliers.
Visualization is not decoration. It is an analytical instrument.
Step 4: Prepare the Features
Raw data is rarely ready for modeling.
Common preparation tasks include:
- Handling missing values.
- Removing duplicate observations.
- Encoding categorical variables.
- Scaling numerical variables when appropriate.
- Creating meaningful features.
- Removing irrelevant variables.
- Checking extreme observations.
Feature engineering can be particularly important in engineering applications.
For example, instead of using only raw vibration measurements, an engineer might derive additional features describing vibration variability or frequency behavior.
Step 5: Split the Dataset
The dataset should normally be divided into training and testing portions.
The training portion is used to develop the model.
The testing portion is kept separate until evaluation.
For more robust assessment, cross-validation can be introduced.
Step 6: Select a Model
Different problems require different approaches.
Common statistical learning models include:
- Linear regression
- Logistic regression
- Decision trees
- Random forests
- Support vector machines
- k-nearest neighbors
- Gradient boosting
- Principal component analysis
- Clustering methods
Model selection should consider the problem, dataset size, interpretability requirements, computational resources, and expected deployment environment.
Step 7: Train the Model
A Python library such as scikit-learn can handle much of the computational work.
A typical workflow conceptually looks like:
Input Data → Preprocessing → Model Training → Predictions
The model learns patterns from the training data.
Step 8: Evaluate Performance
Evaluation depends on the problem.
For regression, engineers may examine:
- Mean absolute error
- Mean squared error
- Root mean squared error
- Coefficient of determination
For classification, useful metrics include:
- Accuracy
- Precision
- Recall
- F1-score
- ROC-AUC
- Confusion matrix
One metric rarely tells the entire story.
Step 9: Interpret the Results
A model is not automatically useful simply because its performance score is high.
The engineer should ask:
- Why does the model behave this way?
- Which features matter?
- Where does it make mistakes?
- Does it behave differently for different groups?
- Are the predictions physically reasonable?
- Can the results be explained to stakeholders?
Interpretability becomes particularly important in engineering, finance, healthcare, infrastructure, and safety-critical systems.
Step 10: Deploy and Monitor
Once validated, a model may become part of a real system.
For example:
Sensor → Data Pipeline → Statistical Model → Prediction → Engineer Alert
However, deployment is not the end.
Real-world data changes over time. Equipment ages. Customer behavior changes. Operating conditions shift.
Therefore, statistical learning systems should be monitored and periodically reevaluated.
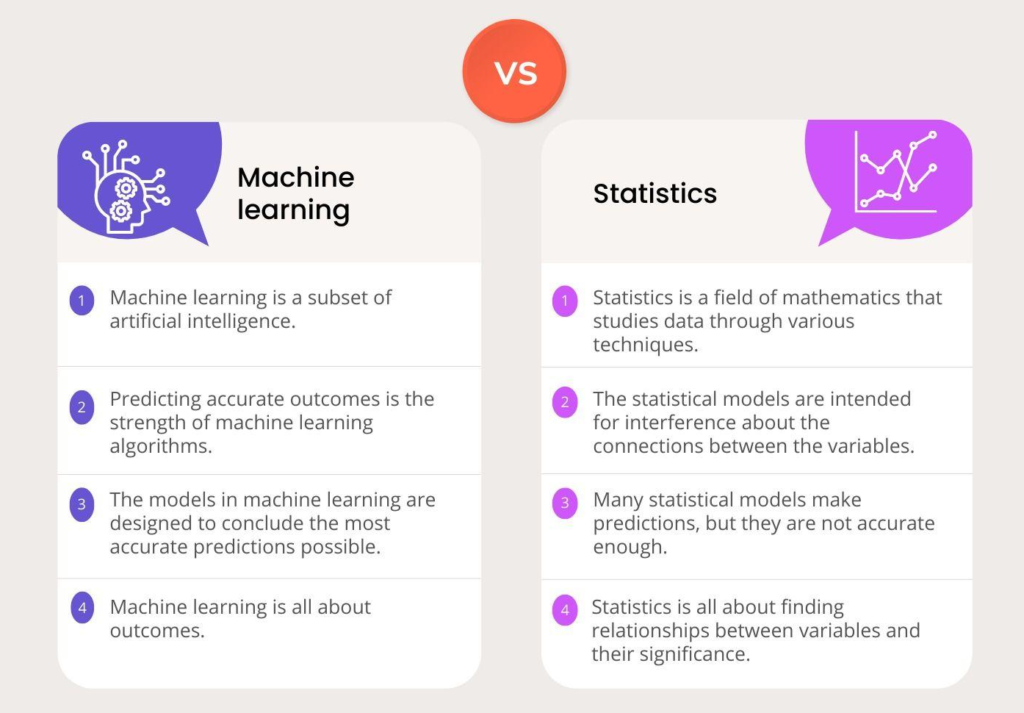
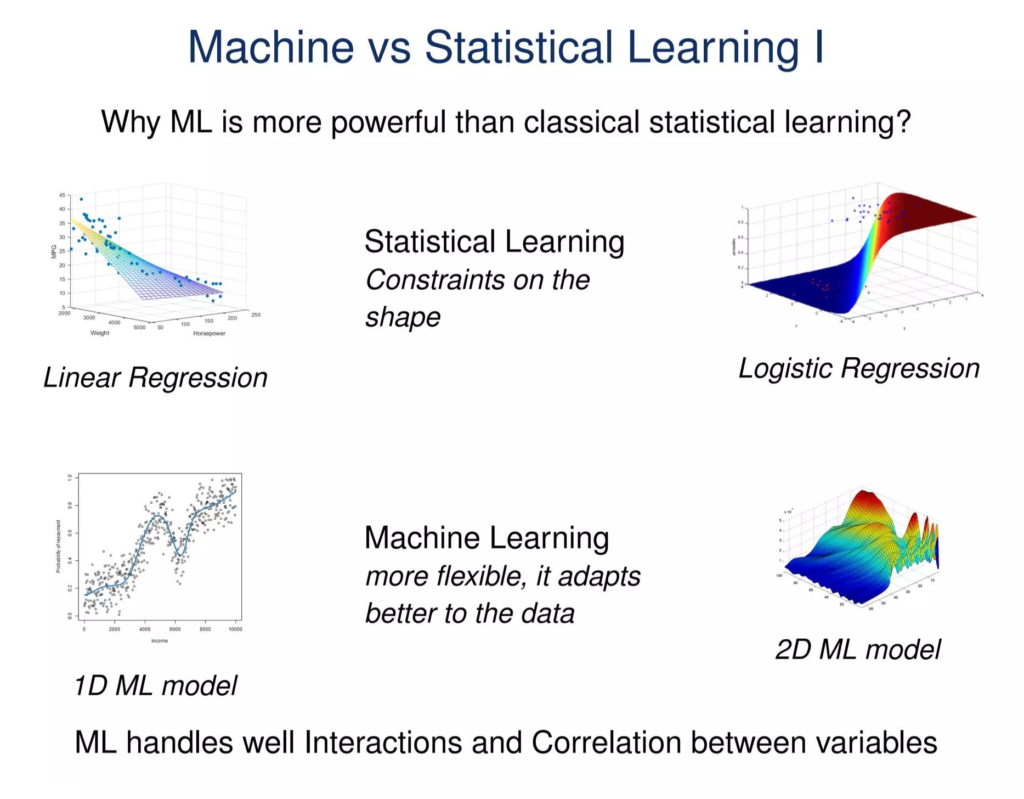
Comparison: Statistical Learning vs Traditional Statistics vs Machine Learning


| Aspect | Traditional Statistics | Statistical Learning | Machine Learning |
|---|---|---|---|
| Main focus | Inference and relationships | Prediction and understanding | Prediction and automation |
| Interpretability | Often high | Low to high | Varies |
| Data size | Small to large | Small to large | Often large |
| Model complexity | Often controlled | Flexible | Often highly flexible |
| Prediction | Important | Very important | Central |
| Uncertainty | Strong emphasis | Important | Varies by method |
| Automation | Moderate | Moderate to high | High |
| Engineering use | Experiments and analysis | Modeling and prediction | Intelligent systems |
The categories overlap considerably. Modern statistical learning frequently uses techniques traditionally associated with statistics and machine learning.
Diagrams and Learning Architecture
The Statistical Learning Pipeline
A useful conceptual diagram is:
┌───────────────────┐
│   Engineering     │
│     Problem       │
└─────────┬─────────┘
          ↓
┌───────────────────┐
│ Data Collection   │
└─────────┬─────────┘
          ↓
┌───────────────────┐
│ Data Exploration  │
└─────────┬─────────┘
          ↓
┌───────────────────┐
│ Preprocessing &   │
│ Feature Creation  │
└─────────┬─────────┘
          ↓
┌───────────────────┐
│ Model Selection   │
└─────────┬─────────┘
          ↓
┌───────────────────┐
│ Training &        │
│ Validation        │
└─────────┬─────────┘
          ↓
┌───────────────────┐
│ Evaluation        │
└─────────┬─────────┘
          ↓
┌───────────────────┐
│ Deployment        │
└─────────┬─────────┘
          ↓
      Monitoring
Model Complexity
A fundamental concept is the relationship between model complexity and generalization.
Too Simple          Appropriate          Too Complex
     │                   │                    │
     ▼                   ▼                    ▼
Underfitting       Good Generalization     Overfitting
     │                   │                    │
Low flexibility     Balanced model       High flexibility


The ideal model captures meaningful structure while avoiding unnecessary sensitivity to noise.
Practical Examples
Example 1: Predicting Building Energy Demand
A building engineer collects historical information about:
- Outdoor temperature
- Occupancy
- Building area
- Time of day
- Day of week
- HVAC operating status
The objective is to predict future energy consumption.
A regression model can learn relationships between these variables and historical energy demand.
The result can help facility managers schedule equipment more efficiently.
Example 2: Manufacturing Quality Control
A factory records:
- Machine temperature
- Production speed
- Material characteristics
- Pressure
- Tool age
- Final product quality
Statistical learning can identify conditions associated with defective products.
Instead of inspecting every product manually, the system can provide an early warning when operating conditions resemble historical failure patterns.
Example 3: Civil Engineering
A civil engineering team could analyze historical structural inspection data.
Features might include:
- Material type
- Age
- Environmental exposure
- Load conditions
- Inspection observations
A classification model could help prioritize structures for further inspection.
The model does not replace professional engineering judgment. Instead, it helps engineers focus attention where it may be most valuable.
Real-World Applications
Statistical learning has applications across almost every engineering discipline.
Mechanical Engineering ⚙️
Applications include:
- Predictive maintenance
- Failure detection
- Process optimization
- Equipment monitoring
- Remaining-useful-life estimation
Electrical Engineering ⚡
Applications include:
- Load forecasting
- Fault detection
- Power-quality analysis
- Renewable-energy prediction
- Smart-grid analytics
Civil Engineering 🏗️
Applications include:
- Structural health monitoring
- Traffic prediction
- Construction productivity analysis
- Infrastructure risk assessment
- Material performance prediction
Chemical Engineering 🧪
Statistical learning can support:
- Process control
- Quality prediction
- Fault detection
- Yield optimization
- Sensor analysis
Software and Data Engineering 💻
Applications include:
- Anomaly detection
- Recommendation systems
- Demand forecasting
- Automated classification
- Log analysis
Common Mistakes
Starting With the Algorithm
Choosing a sophisticated model before understanding the problem often creates unnecessary complexity.
Better approach: define the objective first.
Ignoring Data Quality
A powerful model cannot compensate for unreliable measurements.
Garbage data can produce impressive-looking but misleading results.
Data Leakage
Data leakage occurs when information that should be unavailable during prediction accidentally enters the training process.
This can produce unrealistically strong performance.
Using Only Accuracy
A classification model can achieve high accuracy while performing poorly on an important minority class.
Always select metrics based on the actual problem.
Overfitting the Training Data
A model may memorize noise instead of learning general patterns.
Use validation strategies and keep a genuinely unseen test set.
Ignoring Domain Knowledge
An algorithm does not automatically understand physics, manufacturing constraints, engineering standards, or operational limitations.
Human expertise remains essential.
Challenges and Solutions
| Challenge | Why It Matters | Practical Solution |
|---|---|---|
| Missing data | Reduces reliability | Investigate the cause and apply appropriate treatment |
| Outliers | Can distort models | Investigate before removing |
| Small datasets | Limited learning capacity | Use simpler models and careful validation |
| High-dimensional data | Adds complexity | Feature selection or dimensionality reduction |
| Imbalanced classes | Important cases may be missed | Use suitable metrics and sampling strategies |
| Overfitting | Poor generalization | Cross-validation and regularization |
| Data drift | Model performance declines | Continuous monitoring |
| Poor interpretability | Difficult decisions | Prefer explainable models where necessary |
Case Study: Predictive Maintenance for an Industrial Motor
The Problem
Imagine an industrial facility operating hundreds of electric motors.
Unexpected motor failures can cause:
- Production delays
- Maintenance costs
- Safety concerns
- Equipment damage
- Reduced productivity
The engineering team decides to develop a statistical learning system.
Data Collection
Sensors record:
- Motor temperature
- Vibration
- Current
- Operating speed
- Load
- Operating duration
Historical maintenance records identify whether a motor eventually required intervention.
Data Exploration
The team discovers that certain operating patterns frequently occur before maintenance events.
However, they also discover missing sensor values and inconsistent measurement intervals.
The data must therefore be cleaned before modeling.
Model Development
The engineers compare several classification approaches.
A simpler model performs reasonably well and has the advantage of being easy to explain.
A more complex ensemble model performs better but requires additional validation and interpretation.
The team does not automatically choose the most complex model.
Instead, they consider the operational consequences of incorrect predictions.
Deployment
The final system analyzes incoming sensor information.
When the pattern becomes sufficiently unusual, the maintenance team receives an alert.
The system does not declare:
“The motor will definitely fail.”
Instead, it provides a risk signal that supports engineering investigation.
Outcome
The greatest benefit is not merely prediction accuracy.
The organization gains a proactive maintenance process that can help engineers investigate problems before they become expensive failures.
This illustrates an important principle:
Statistical learning is most valuable when predictions lead to better decisions. 🎯
Essential Tips for Learning Statistical Learning With Python
Build Strong Python Foundations
Before jumping into advanced machine learning, become comfortable with:
- Variables
- Functions
- Loops
- Lists and dictionaries
- Classes
- File handling
- Exceptions
- Modules
Learn pandas Thoroughly
pandas is essential for practical data manipulation.
Learn how to:
- Load datasets.
- Filter rows.
- Select columns.
- Group records.
- Merge datasets.
- Handle missing values.
- Transform columns.
Master Visualization
Learn to recognize patterns visually.
Practice with:
- Histograms
- Scatter plots
- Box plots
- Line charts
- Heatmaps
Good visualization helps prevent incorrect assumptions.
Understand the Data Before the Model
Spend time asking:
What does each variable actually mean?
A technically perfect model built from poorly understood variables can still produce meaningless results.
Start With Simple Models
Linear regression, logistic regression, decision trees, and basic clustering methods are excellent learning tools.
Simple models teach concepts that remain relevant when working with advanced algorithms.
Validate Everything
Never assume that a model works simply because the training output looks impressive.
Use appropriate validation and testing strategies.
Combine Statistical and Engineering Knowledge
The strongest engineering data scientists understand both:
How the model works
and
Why the engineering system behaves the way it does.
FAQs
What is statistical learning in simple terms?
Statistical learning is a way of using data to discover useful patterns and relationships that can support prediction, classification, explanation, or decision-making.
Is statistical learning the same as machine learning?
They overlap significantly, but they are not exactly identical. Statistical learning places strong emphasis on understanding relationships, prediction, model validation, and statistical reasoning, while machine learning often emphasizes predictive performance and scalable automated systems.
Is Python good for statistical learning?
Yes. Python provides a mature ecosystem for data manipulation, visualization, statistics, machine learning, and scientific computing.
What Python libraries should beginners learn?
A practical starting combination is NumPy, pandas, Matplotlib, Seaborn, SciPy, and scikit-learn. Later, students can explore statsmodels and specialized machine learning or deep learning frameworks.
Do I need advanced mathematics?
You can begin statistical learning without advanced mathematics. However, deeper study eventually benefits from knowledge of probability, statistics, linear algebra, optimization, and calculus.
Should engineers learn statistical learning?
Yes. Engineers increasingly work with sensor data, simulations, experiments, monitoring systems, optimization, and automated decision systems. Statistical learning provides valuable tools for analyzing these datasets.
What is overfitting?
Overfitting occurs when a model learns the training data too closely, including noise or accidental patterns, and consequently performs poorly on new data.
Can statistical learning replace engineers?
No. Statistical learning is a decision-support technology. Engineering knowledge remains necessary for defining meaningful problems, validating assumptions, understanding physical systems, assessing risk, and making final decisions.
Conclusion
Statistical learning provides a powerful framework for turning raw data into useful engineering knowledge. It combines statistical thinking, programming, visualization, machine learning, and domain expertise into a practical workflow.
For beginners, the journey can start with a simple sequence:
Python → pandas → Visualization → Statistics → scikit-learn → Model Evaluation → Engineering Application
For advanced learners, the next steps include model selection, regularization, feature engineering, cross-validation, dimensionality reduction, ensemble methods, interpretability, uncertainty analysis, and production monitoring.
The most important lesson is that statistical learning is not simply about finding the most sophisticated algorithm. It is about creating a reliable connection between data and decisions.
Whether the goal is predicting machine failures, estimating energy demand, analyzing structural behavior, forecasting production, or detecting anomalies, Python provides an accessible environment for developing these capabilities.
🚀 Learn the statistics. Understand the data. Build the model. Validate the result. Then use engineering judgment to turn the prediction into action.
That workflow is the real foundation of statistical learning with Python.




