
Advanced Data Science and Analytics with Python: The Complete Engineering Guide for Modern Data-Driven Innovation 🚀📊
Introduction 📊🤖
The digital era has transformed the way engineers, scientists, researchers, and businesses solve complex problems. Every second, billions of pieces of information are generated from sensors, industrial machines, healthcare systems, financial markets, satellites, social media, and IoT devices. Converting this massive volume of raw information into meaningful insights requires advanced data science and analytics.
Python has become the world’s leading programming language for data science because it combines simplicity, flexibility, and an extensive ecosystem of scientific libraries. Whether building predictive maintenance systems for factories, analyzing healthcare records, optimizing supply chains, or creating artificial intelligence applications, Python offers powerful tools that simplify advanced analytical workflows.
Today’s organizations across the United States, United Kingdom, Canada, Australia, and Europe increasingly rely on Python-powered analytics to improve efficiency, reduce costs, and make informed decisions. Engineers now combine statistical methods, machine learning, cloud computing, and data visualization into intelligent systems capable of learning from historical information.
This comprehensive guide explores advanced data science using Python from both beginner and professional engineering perspectives while providing practical examples, diagrams, comparisons, and real-world applications.


Background Theory 🧠📈
Data science is an interdisciplinary engineering field combining:
- 📊 Statistics
- 💻 Computer Science
- 🤖 Artificial Intelligence
- 📐 Mathematics
- 🏭 Engineering
- ☁️ Cloud Computing
- 📡 Big Data Technologies
Traditional analytics mainly answered:
- What happened?
- Why did it happen?
Modern analytics answers much more:
- What will happen?
- What should happen?
- How can systems optimize themselves automatically?
Advanced analytics typically follows this lifecycle:
- Data Collection
- Data Cleaning
- Feature Engineering
- Exploratory Data Analysis (EDA)
- Model Development
- Validation
- Deployment
- Monitoring
- Continuous Learning
This engineering workflow allows organizations to transform raw datasets into actionable business intelligence.
Definition 📚
Advanced Data Science with Python refers to the engineering discipline of collecting, processing, analyzing, modeling, visualizing, and deploying large-scale datasets using Python programming and advanced computational algorithms.
It combines:
- Machine Learning
- Deep Learning
- Predictive Analytics
- Statistical Modeling
- Big Data Processing
- Data Engineering
- Cloud Analytics
- Business Intelligence
The objective is not simply analyzing historical information—but building intelligent systems capable of prediction, optimization, automation, and decision support.
Core Python Technologies 🐍
Popular libraries include:
| Library | Primary Purpose |
|---|---|
| NumPy | Numerical Computing |
| Pandas | Data Manipulation |
| Matplotlib | Visualization |
| Plotly | Interactive Dashboards |
| Seaborn | Statistical Graphics |
| SciPy | Scientific Computing |
| Scikit-Learn | Machine Learning |
| TensorFlow | Deep Learning |
| PyTorch | AI Research |
| XGBoost | Gradient Boosting |
| LightGBM | High-Speed Learning |
| CatBoost | Categorical Machine Learning |
Step-by-Step Advanced Data Science Workflow ⚙️


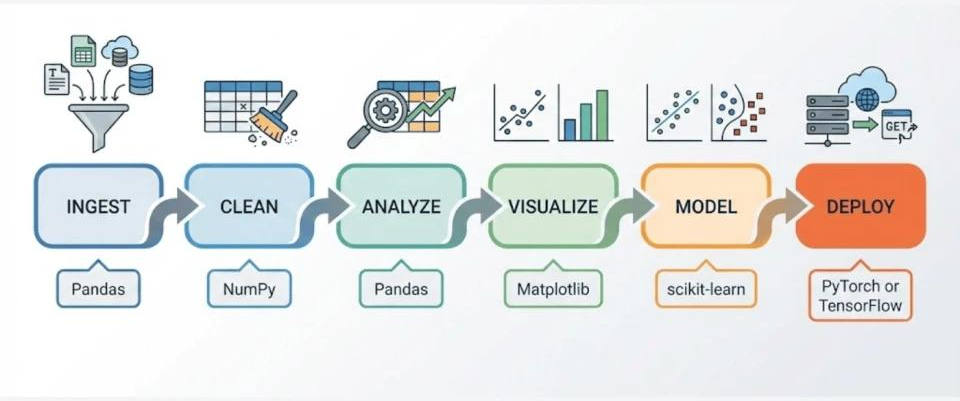


Step 1 — Define the Engineering Problem 🎯
Every project starts with a clear objective.
Examples:
- Predict equipment failure
- Forecast electricity demand
- Detect fraudulent transactions
- Classify medical images
- Optimize logistics
Without a defined objective, analytics becomes directionless.
Step 2 — Collect Data 📥
Sources include:
- SQL databases
- APIs
- CSV files
- Excel
- IoT sensors
- Industrial PLCs
- ERP systems
- Cloud storage
- Web scraping
Quality data is more valuable than large quantities of poor-quality information.
Step 3 — Clean the Data 🧹
Cleaning tasks include:
✔ Removing duplicates
✔ Handling missing values
📈 Correcting formatting
✔ Detecting outliers
✔ Standardizing units
📈 Data validation
Poor-quality data often causes inaccurate machine learning models.
Step 4 — Exploratory Data Analysis (EDA) 🔍
Engineers investigate:
- Variable distributions
- Correlations
- Missing information
- Trends
- Seasonal effects
- Relationships
Visualization reveals hidden patterns impossible to detect from tables alone.
Step 5 — Feature Engineering ⚡
Feature engineering transforms raw information into meaningful variables.
Examples:
Original Data:
- Timestamp
- Temperature
- Pressure
Engineered Features:
- Rolling averages
- Lag variables
- Hour of day
- Weekend indicator
- Pressure change rate
- Temperature gradient
Feature engineering frequently improves model performance more than changing algorithms.
Step 6 — Model Development 🤖
Engineers choose algorithms based on objectives.
Regression:
- Linear Regression
- Random Forest
- Gradient Boosting
Classification:
- Logistic Regression
- Support Vector Machines
- XGBoost
Clustering:
- K-Means
- DBSCAN
- Hierarchical Clustering
Deep Learning:
- CNN
- RNN
- Transformers
Step 7 — Model Evaluation 📈
Performance metrics include:
Regression
- RMSE
- MAE
- R²
Classification
- Accuracy
- Precision
- Recall
- F1 Score
- ROC-AUC
Proper evaluation prevents overfitting.
Step 8 — Deployment ☁️
Production deployment may use:
- Docker
- Kubernetes
- FastAPI
- Flask
- AWS
- Azure
- Google Cloud
Deployment transforms research models into business solutions.
Step 9 — Continuous Monitoring 🔄
Real-world models gradually lose accuracy because environments change.
Monitoring tracks:
- Prediction accuracy
- Data drift
- Concept drift
- Model latency
- System reliability
Continuous retraining keeps models effective.
Comparison ⚖️
| Feature | Traditional Analytics | Advanced Analytics |
|---|---|---|
| Data Size | Small | Massive |
| Processing | Manual | Automated |
| Predictions | Limited | Excellent |
| Machine Learning | No | Yes |
| Deep Learning | No | Yes |
| Automation | Low | High |
| Real-Time Analysis | Rare | Common |
| Cloud Integration | Limited | Extensive |
Engineering Architecture, Visual Workflow & Analytics Components 🏗️


Typical Data Science Pipeline
| Layer | Components |
|---|---|
| Data Sources | IoT, ERP, Databases |
| Storage | SQL, Data Lake, Cloud |
| Processing | Pandas, Spark |
| Analytics | Python Models |
| Machine Learning | Scikit-Learn, TensorFlow |
| Visualization | Plotly, Power BI |
| Deployment | APIs, Cloud Services |
Engineering Workflow Table
| Stage | Objective | Tools |
|---|---|---|
| Collection | Acquire data | APIs, SQL |
| Cleaning | Improve quality | Pandas |
| Analysis | Discover insights | NumPy |
| Modeling | Predictions | Scikit-Learn |
| Validation | Evaluate | Cross Validation |
| Deployment | Production | FastAPI |
| Monitoring | Reliability | ML Monitoring |
Practical Examples 💡
Example 1 — Predictive Maintenance 🏭
A manufacturing plant collects:
- Temperature
- Motor vibration
- Current consumption
Python predicts machine failure before breakdown, reducing downtime.
Example 2 — Healthcare Analytics 🏥
Hospitals analyze:
- Patient records
- Medical imaging
- Laboratory tests
Machine learning predicts disease risk and assists diagnosis.
Example 3 — Financial Forecasting 💰
Banks analyze:
- Credit history
- Customer spending
- Transaction behavior
Python detects fraud within milliseconds.
Example 4 — Smart Agriculture 🌾
Sensors monitor:
- Soil moisture
- Temperature
- Humidity
Analytics recommends optimal irrigation schedules.
Example 5 — Energy Optimization ⚡
Power utilities forecast electricity demand, reducing energy waste while maintaining grid stability.
Real-World Applications 🌍
Advanced Python analytics powers nearly every modern industry.
Manufacturing
- Predictive maintenance
- Quality inspection
- Process optimization
Healthcare
- Disease prediction
- Medical imaging
- Personalized medicine
Transportation
- Route optimization
- Autonomous vehicles
- Traffic forecasting
Finance
- Fraud detection
- Credit scoring
- Risk analysis
Retail
- Recommendation systems
- Customer segmentation
- Inventory optimization
Aerospace
- Flight analytics
- Satellite data processing
- Structural monitoring
Environmental Engineering
- Climate prediction
- Air quality monitoring
- Flood forecasting
Cybersecurity
- Threat detection
- Network anomaly identification
- Malware classification
Common Mistakes ❌
Many beginners and even experienced practitioners encounter avoidable pitfalls:
- 🚫 Ignoring data quality
- 🚫 Skipping exploratory analysis
- 📈 Using unnecessary complex models
- 🚫 Overfitting training data
- 🚫 Data leakage
- 📈 Poor feature selection
- 🚫 Ignoring business objectives
- 🚫 Lack of documentation
- 📈 Not monitoring deployed models
- 🚫 Insufficient validation
Challenges & Solutions 🛠️
| Challenge | Solution |
|---|---|
| Missing Data | Imputation methods |
| Huge Datasets | Distributed computing |
| Model Drift | Continuous retraining |
| High Computation | GPU acceleration |
| Data Privacy | Encryption & anonymization |
| Bias | Balanced datasets |
| Deployment Complexity | Containerization |
| Scalability | Cloud infrastructure |
Case Study 🏭📈
Industrial Predictive Maintenance
An automotive manufacturing facility experienced frequent production interruptions due to unexpected motor failures.
Initial Situation
- 150 industrial motors
- Frequent downtime
- High maintenance costs
- Manual inspections
Python-Based Solution
Engineers collected:
- Vibration readings
- Temperature measurements
- Current signals
- Operating hours
Using Random Forest and Gradient Boosting models, the maintenance team predicted failures several days before they occurred.
Results
✔ 42% reduction in unexpected downtime
✔ 28% lower maintenance costs
📈 Improved equipment lifespan
✔ Higher production efficiency
✔ Better workforce planning
The project demonstrated how advanced analytics can transform reactive maintenance into proactive engineering management.
Essential Tips 💎
- 📌 Always understand the engineering problem before selecting algorithms.
- 📌 Invest time in cleaning data.
- 📈 Feature engineering often provides greater improvements than changing models.
- 📌 Validate models using unseen datasets.
- 📌 Monitor deployed models continuously.
- 📈 Automate repetitive workflows.
- 📌 Learn statistics alongside machine learning.
- 📌 Document every experiment.
- 📈 Use version control for datasets and code.
- 📌 Keep learning emerging AI technologies.
Frequently Asked Questions ❓
Is Python still the best language for data science?
Yes. Python remains the most widely used language due to its rich ecosystem, readability, and strong community support.
Do I need advanced mathematics?
Basic statistics, probability, linear algebra, and calculus are helpful. More advanced mathematics becomes valuable for deep learning and research.
Which library should beginners learn first?
Start with Pandas and NumPy, then progress to Matplotlib, Scikit-Learn, and eventually TensorFlow or PyTorch.
Can Python handle big data?
Yes. Python integrates with technologies such as Apache Spark, Dask, Hadoop, and cloud platforms to process very large datasets.
Is machine learning the same as data science?
No. Machine learning is one component of data science. Data science also includes data engineering, statistics, visualization, and business understanding.
How important is data visualization?
Extremely important. Visualization helps engineers identify trends, communicate findings, and validate analytical results effectively.
What industries hire Python data scientists?
Manufacturing, healthcare, finance, aerospace, automotive, energy, retail, telecommunications, government, and technology companies all actively recruit Python data science professionals.
Conclusion 🎯
Advanced Data Science and Analytics with Python has become a cornerstone of modern engineering, enabling organizations to convert vast amounts of raw information into intelligent decisions. By integrating robust data collection, rigorous preprocessing, insightful exploration, feature engineering, machine learning, and scalable deployment, Python empowers professionals to build predictive and automated systems across industries—from manufacturing and healthcare to finance and environmental monitoring.
For beginners, mastering foundational libraries such as NumPy and Pandas creates a strong starting point. For experienced engineers, expanding into advanced machine learning, cloud-native deployment, distributed computing, and continuous model monitoring unlocks the ability to solve increasingly complex real-world problems. As artificial intelligence, big data, and automation continue to evolve, Python remains one of the most versatile and future-proof tools for driving innovation, improving operational efficiency, and shaping the next generation of intelligent engineering solutions.




