
A Hands-On Introduction to Data Science: Practical Guide for Beginners and Professionals
Introduction
Data science has become one of the most influential technical disciplines in modern engineering, business, research, healthcare, finance, and technology. Every day, organizations generate enormous quantities of information from websites, sensors, mobile applications, industrial machines, customer transactions, scientific experiments, and connected devices. 📊💻
But raw data has limited value by itself. The real advantage comes from transforming data into reliable information, discovering patterns, making predictions, and supporting better decisions.
A hands-on approach to data science is particularly valuable because the field combines several disciplines rather than depending on a single programming language or mathematical technique. A practical data scientist may need to understand programming, statistics, databases, visualization, machine learning, data cleaning, communication, and domain-specific engineering knowledge.

For students, learning by building small projects is often more effective than studying theoretical concepts independently. For professionals, hands-on experimentation makes it easier to connect analytical techniques with real operational problems.
This article presents a practical introduction to data science, starting with fundamental concepts and progressing toward real-world applications, common mistakes, challenges, and project-based thinking. 🚀


Background Theory
Data science developed from the convergence of several technical areas.
Statistics provides methods for understanding uncertainty, distributions, relationships, and variation. Computer science contributes programming, algorithms, databases, and computational infrastructure. Mathematics provides foundations for optimization and modeling. Domain knowledge helps analysts understand whether the results actually make sense.
Modern data science also incorporates machine learning and artificial intelligence.
From Data to Knowledge
A useful way to understand the discipline is as a transformation:
Raw data → Clean data → Information → Insights → Decisions
For example, an engineering company might collect sensor readings from industrial equipment. Those readings initially appear as thousands or millions of individual records. After cleaning and analysis, engineers may discover that certain sensor patterns frequently appear before equipment failures.
That insight can eventually support predictive maintenance.
Why Hands-On Learning Matters
Data science contains many concepts that can seem abstract when studied separately.
A learner may understand what a classification algorithm is but still struggle when confronted with:
- Missing values
- Duplicate records
- Incorrect data types
- Unusual observations
- Unbalanced datasets
- Poorly defined objectives
- Misleading visualizations
- Data leakage
Hands-on projects expose these problems naturally.
The Typical Data Science Lifecycle
A practical project commonly follows these stages:
- Define the problem.
- Collect data.
- Inspect the dataset.
- Clean and prepare the data.
- Explore patterns.
- Visualize important findings.
- Build analytical or predictive models.
- Evaluate results.
- Communicate conclusions.
- Deploy or operationalize the solution.
- Monitor performance.
The process is rarely perfectly linear. Data scientists often move backward when they discover that an assumption was incorrect.
Definition
Data science can be defined as the interdisciplinary practice of collecting, preparing, analyzing, modeling, and communicating data to generate useful knowledge and support decisions.
It is broader than data analysis and broader than machine learning.
📊 Data Science vs. Data Analysis
Data analysis generally focuses on examining existing data to answer questions and understand what happened or what is happening.
Data science can include analysis but may also involve:
- Predictive modeling
- Machine learning
- Data engineering
- Automation
- Experimentation
- Large-scale data processing
- Model deployment
Data Science vs. Machine Learning
Machine learning is an important component of data science, but the two terms should not be treated as identical.
A data science project can be successful without sophisticated machine learning. A carefully designed analysis and visualization may provide more value than a complicated model.
Core Skills
A practical data scientist should gradually develop skills in:
Programming: Python, R, SQL, and related technologies.
Statistics: Probability, distributions, sampling, correlation, and inference.
Data management: Databases, structured datasets, APIs, and data pipelines.
Visualization: Charts, dashboards, and visual storytelling.
Machine learning: Classification, regression, clustering, and model evaluation.
Communication: Explaining technical findings to nontechnical stakeholders.
Step-by-Step Data Science Workflow
A hands-on project becomes easier when divided into manageable stages.


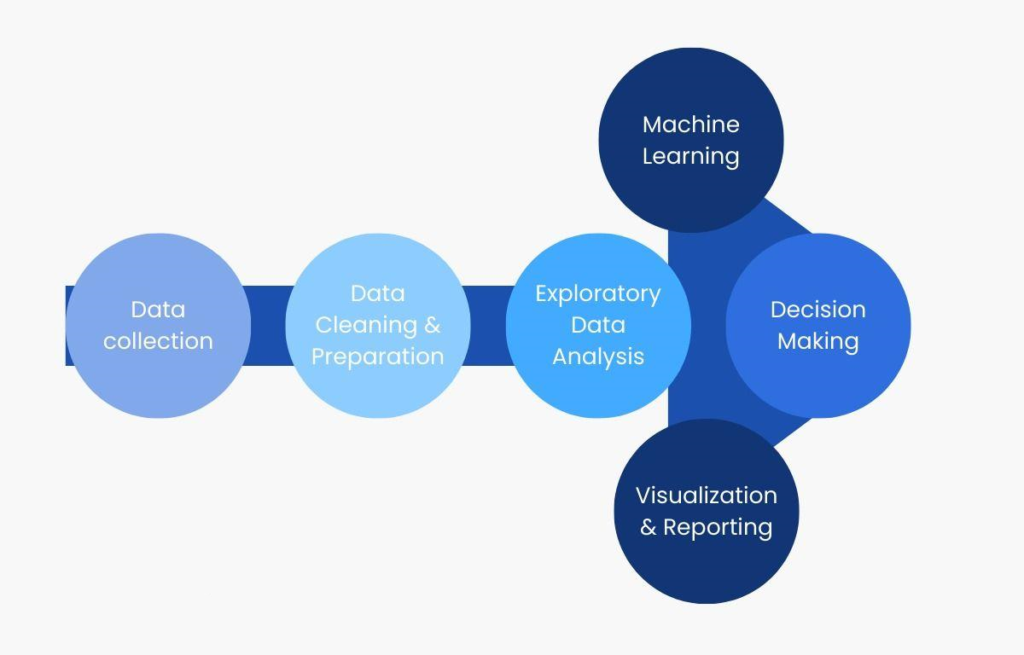
Step 1: Define the Problem
Before opening a programming environment, determine what you are trying to solve.
A weak question might be:
“What can we discover in this dataset?”
A stronger question is:
“Which factors are associated with customer churn, and can we identify customers who may be at higher risk?”
A clear objective determines what data is required and which analytical techniques are appropriate.
Step 2: Collect Data
Data can come from many sources:
- Databases
- Public datasets
- APIs
- Sensors
- Surveys
- Business systems
- Scientific experiments
- Web applications
- Transaction records
The quality and relevance of the data are more important than simply having a large dataset.
Step 3: Inspect the Data
Start by understanding what you actually have.
Check:
- Number of records
- Number of variables
- Variable names
- Data types
- Missing values
- Duplicate observations
- Unusual values
- Categories
- Time ranges
This stage frequently reveals problems that would otherwise damage the analysis.
Step 4: Clean the Data
Data cleaning can include:
- Removing duplicates
- Correcting inconsistent categories
- Handling missing values
- Converting data types
- Standardizing formats
- Detecting suspicious records
- Resolving inconsistent units
Data cleaning is often one of the most time-consuming parts of professional data science.
Step 5: Explore the Dataset
Exploratory data analysis helps you understand relationships and patterns before building models.
Useful questions include:
- Which variables vary the most?
- Are some categories dominant?
- Are there unusual observations?
- Do variables appear related?
- Does behavior change over time?
- Are there differences between groups?
Step 6: Visualize Findings
Visualization converts complex datasets into patterns humans can recognize quickly. 📈
Common visualizations include:
| Visualization | Typical Purpose |
|---|---|
| Bar chart | Compare categories |
| Line chart | Examine trends over time |
| Histogram | Understand distributions |
| Scatter plot | Explore relationships |
| Box plot | Compare distributions |
| Heatmap | Examine patterns across variables |
| Dashboard | Monitor multiple metrics |
Step 7: Build a Model When Necessary
If the problem requires prediction or automated decision-making, machine learning may be appropriate.
Typical tasks include:
Regression: Predict a continuous outcome.
Classification: Assign observations to categories.
Clustering: Discover groups within data.
Anomaly detection: Identify unusual behavior.
The simplest suitable model should usually be tested before introducing more complicated algorithms.
Step 8: Evaluate the Result
A model should not be judged simply because it produces predictions.
Evaluation depends on the problem.
For example, classification projects may consider precision, recall, accuracy, or other task-specific metrics.
More importantly, evaluation should use data that was not used to train the model.
Step 9: Communicate the Result
A technically impressive analysis can fail if nobody understands its conclusion.
A professional report should explain:
- 📊 What was investigated
- What data was used
- What was discovered
- How reliable the result is
- What limitations exist
- What action is recommended
Comparison of Data Science Approaches
Different analytical approaches solve different problems.
| Approach | Main Question | Typical Output |
|---|---|---|
| Descriptive analysis | What happened? | Reports and summaries |
| Diagnostic analysis | Why did it happen? | Relationships and explanations |
| Predictive analysis | What might happen? | Forecasts or predictions |
| Prescriptive analysis | What should we do? | Recommended actions |
| Machine learning | Can patterns be learned automatically? | Predictive or classification models |
Traditional Analysis vs. Machine Learning
Traditional statistical analysis often emphasizes interpretable relationships and inference.
Machine learning frequently emphasizes predictive performance.
Neither approach is universally superior.
For an engineering application where explainability is critical, a simpler interpretable approach may be preferable. For a large-scale prediction problem, machine learning may offer substantial benefits.
Diagrams and Tables
A simplified data science architecture can be represented as:
       DATA SOURCES
            │
            ▼
   ┌─────────────────┐
   │ Data Collection │
   └────────┬────────┘
            ▼
   ┌─────────────────┐
   │ Data Cleaning   │
   └────────┬────────┘
            ▼
   ┌─────────────────┐
   │ Data Exploration │
   └────────┬────────┘
            ▼
   ┌─────────────────┐
   │ Visualization   │
   └────────┬────────┘
            ▼
   ┌─────────────────┐
   │ Modeling        │
   └────────┬────────┘
            ▼
   ┌─────────────────┐
   │ Evaluation      │
   └────────┬────────┘
            ▼
   ┌─────────────────┐
   │ Decision/Action │
   └─────────────────┘


Practical Tool Categories
| Task | Common Tool Categories |
|---|---|
| Programming | Python, R |
| Database queries | SQL |
| Data manipulation | DataFrame libraries |
| Visualization | Plotting libraries |
| Machine learning | ML frameworks |
| Notebooks | Interactive notebook environments |
| Dashboards | BI and visualization platforms |
| Collaboration | Git and cloud platforms |
Tools change over time, so students should focus on transferable concepts rather than memorizing a particular software interface.
Practical Examples Without Equations
Example 1: Predicting Equipment Failure
Imagine a manufacturing plant collecting temperature, vibration, pressure, and operating-status information from machines.
A data science team could analyze historical records and identify patterns that frequently occur before failures.
The final system could alert maintenance engineers before a machine stops unexpectedly.
Example 2: Customer Churn
A telecommunications company might analyze customer activity, subscription information, service usage, and support interactions.
The objective could be identifying customers who are more likely to leave.
The company could then investigate the underlying reasons and design appropriate retention strategies.
Example 3: Energy Consumption
An engineering facility may collect electricity consumption from different buildings.
Data scientists can visualize usage across hours, days, seasons, and equipment categories. The analysis may reveal inefficient operating schedules or unusual consumption patterns.
Example 4: Transportation
Transportation companies can analyze historical trips, traffic conditions, weather information, and vehicle data.
The results may help improve route planning, maintenance schedules, and operational efficiency.
Real-World Applications
Data science is now integrated into numerous engineering and professional environments. 🌍
Engineering
Engineers use data science for:
- Predictive maintenance
- Quality control
- Process optimization
- Structural monitoring
- Energy management
- Sensor analysis
- Fault detection
Healthcare
Data-driven methods can support:
- Medical research
- Patient monitoring
- Resource planning
- Image analysis
- Operational forecasting
Healthcare applications require particularly careful attention to privacy, reliability, validation, and regulatory requirements.
Finance
Financial organizations use analytical systems for:
- Risk assessment
- Fraud detection
- Customer segmentation
- Forecasting
- Portfolio analysis
Retail and E-Commerce
Retail companies can analyze customer behavior to improve:
- Inventory planning
- Product recommendations
- Demand forecasting
- Customer segmentation
- Marketing strategies
Scientific Research
Researchers use data science to process experimental datasets, identify patterns, automate analysis, and develop computational models.
Common Mistakes
Starting With the Algorithm
One of the most common beginner mistakes is selecting a machine-learning algorithm before understanding the problem.
Start with the question, not the algorithm.
Ignoring Data Quality
A sophisticated model cannot automatically transform poor-quality data into reliable information.
Better approach: investigate data quality before modeling.
Using Too Many Features
More variables do not automatically produce a better model.
Unnecessary variables can increase complexity, introduce noise, and make interpretation harder.
Confusing Correlation With Causation
Two variables may change together without one causing the other.
A data scientist should distinguish between an observed relationship and a demonstrated causal mechanism.
Overfitting
A model can perform extremely well on training data but poorly on new observations.
This is why independent evaluation is essential.
Poor Visualization
Overloaded charts, misleading scales, unnecessary decoration, and unclear labels can hide important information.
Good visualization should make the intended message easier to understand.
Challenges and Solutions
| Challenge | Practical Solution |
|---|---|
| Missing data | Investigate why values are missing before selecting a treatment |
| Inconsistent records | Standardize formats and categories |
| Limited data | Consider collecting more representative observations |
| Biased data | Evaluate how the dataset was generated |
| Overfitting | Use appropriate validation procedures |
| Poor interpretability | Compare with simpler models |
| Large datasets | Use efficient processing and suitable infrastructure |
| Changing data | Monitor model and data performance |
| Difficult communication | Use concise visual explanations |
Data Bias
Bias is one of the most important challenges in practical data science.
If historical data does not represent the real population or operating environment, a model may produce systematically poor results.
The solution is not simply to use more data. The data must also be relevant and representative.
Model Drift
Real-world conditions change.
Customer behavior, market conditions, machine characteristics, and environmental conditions may evolve after a model is deployed.
A model that worked well six months ago may gradually lose effectiveness.
Continuous monitoring is therefore an important part of professional data science.
Case Study: Predictive Maintenance in Manufacturing
Consider a fictional manufacturing facility operating hundreds of industrial machines.
The company experiences unexpected equipment failures. Each failure causes production delays, emergency maintenance, and additional costs.
Problem Definition
The engineering team wants to determine whether sensor information can provide early warning of potential equipment problems.
Data Collection
Sensors generate information related to:
- Temperature
- Vibration
- Pressure
- Operating duration
- Machine status
- Maintenance history
Data Preparation
The team checks sensor records for missing readings, duplicate events, incorrect timestamps, and abnormal measurements.
Maintenance records are then connected with historical sensor observations.
Exploration
Visualization reveals that certain combinations of sensor behavior occur more frequently before maintenance events.
However, the team does not immediately assume that these patterns prove causation. Engineers investigate the physical behavior of the equipment to validate the findings.
Modeling
Several predictive approaches are tested.
The team compares a simple baseline with more sophisticated machine-learning models.
Rather than choosing the most complicated model automatically, engineers consider prediction quality, interpretability, maintenance requirements, and operational cost.
Deployment
The final system produces alerts when incoming sensor behavior resembles patterns associated with potential equipment problems.
Maintenance personnel receive the alerts and inspect the relevant machine.
Outcome
The project demonstrates an important principle: data science is most valuable when analytical results are connected to domain expertise and practical action.
The model itself is only one component of the complete solution.
Essential Tips for Learning Data Science
Build Projects
Do not spend months studying theory without applying it.
Build small projects involving real datasets.
Start with:
- Data cleaning
- Exploratory analysis
- Visualization
- Simple prediction
- Report generation
Then gradually increase complexity.
Learn SQL
SQL remains highly valuable because many professional datasets live inside relational databases.
A data scientist who can efficiently retrieve and manipulate information has a major practical advantage.
Learn Statistics Properly
You do not need to become a theoretical mathematician, but you should understand concepts such as:
- Variation
- Sampling
- Probability
- Distributions
- Correlation
- Uncertainty
- Statistical significance
- Experimental design
Practice Explaining Results
Try explaining a technical result to someone without a data science background.
If you cannot explain what your model discovered and why it matters, additional technical work may be necessary.
Keep a Reproducible Workflow
Organize datasets, scripts, documentation, experiments, and results systematically.
Version control and clear project structure become increasingly important as projects grow.
Think Like an Engineer
Engineering-oriented data science should emphasize reliability, validation, repeatability, and practical constraints.
Ask:
Does the solution work?
Can it be tested?
Can it be maintained?
What happens when the data changes?
What happens when the model is wrong?
These questions separate a classroom experiment from a production-grade system. ⚙️
FAQs
What is data science in simple terms?
Data science is the process of using data, programming, statistics, and analytical techniques to discover useful information, solve problems, and support decisions.
Is data science suitable for beginners?
Yes. Beginners can start with basic programming, data manipulation, visualization, and statistics before progressing toward machine learning and advanced analytics.
Do I need advanced mathematics to learn data science?
Not initially. A solid understanding of basic statistics and logical reasoning is more important at the beginning. More advanced mathematics becomes useful as you study specialized machine-learning and scientific techniques.
Which programming language should I learn first?
Python is an excellent starting point because it is widely used for data manipulation, visualization, automation, scientific computing, and machine learning.
Is machine learning required for data science?
No. Machine learning is an important part of modern data science, but many valuable projects can be completed through data cleaning, statistical analysis, visualization, and reporting.
How long does it take to learn data science?
The timeline varies considerably. A motivated beginner can learn foundational skills relatively quickly, but professional-level competence requires continuous practice and increasingly complex projects.
What type of projects should beginners build?
Good beginner projects include sales analysis, energy-consumption analysis, customer segmentation, sensor-data exploration, transportation analysis, and simple forecasting projects.
Is data science useful for engineers?
Absolutely. Engineers can apply data science to predictive maintenance, process optimization, quality control, simulation data, sensor analytics, energy systems, manufacturing, and reliability engineering.
Conclusion
A hands-on introduction to data science is ultimately an introduction to problem solving with data. 📊🚀
The discipline combines programming, statistics, databases, visualization, machine learning, engineering knowledge, and communication. However, successful data science is not about using the most sophisticated algorithm or creating the most complicated dashboard.
The strongest workflow begins with a well-defined problem, uses appropriate and trustworthy data, carefully prepares that data, explores it systematically, selects suitable analytical methods, validates the results, and communicates the findings clearly.
For beginners, the best strategy is to learn progressively: start with data exploration and visualization, develop programming and SQL skills, strengthen statistical knowledge, and then move into machine learning and advanced analytics.
For professionals, the focus should extend beyond model development toward deployment, monitoring, reliability, interpretability, security, scalability, and measurable business or engineering outcomes.
The most important lesson is simple:
Data becomes valuable when it can support understanding and action. 💡
Whether you are an engineering student analyzing sensor measurements, a researcher processing experimental data, or a professional developing predictive systems, hands-on data science provides a practical framework for turning complex datasets into useful knowledge—and ultimately into better decisions.




