Handbook of Statistical Analysis and Data Mining Applications: The Complete Beginner-to-Professional Guide for Data-Driven Engineering
Introduction 📊🚀
Modern engineering is no longer based solely on calculations and physical experiments. Today, industries generate enormous volumes of data every second from sensors, machines, satellites, medical equipment, manufacturing systems, financial transactions, and online platforms. The ability to extract useful knowledge from these massive datasets has become one of the most valuable engineering skills.
The Handbook of Statistical Analysis and Data Mining Applications is considered one of the most comprehensive references for engineers, scientists, researchers, business analysts, and students who want to transform raw data into meaningful information.
Whether you’re designing smarter manufacturing systems, predicting equipment failures, optimizing energy consumption, or developing artificial intelligence solutions, statistical analysis and data mining provide the mathematical foundation behind these innovations.
This guide explores the fundamental theories, practical applications, engineering techniques, modern software tools, real-world examples, and professional best practices inspired by the concepts presented in this important handbook.


Background Theory 📚
Engineering decisions have always relied on mathematics. However, modern systems produce data at a scale impossible to analyze manually.
Statistical analysis helps engineers:
- Measure uncertainty
- Discover patterns
- Validate hypotheses
- Predict future outcomes
- Optimize processes
- Improve product quality
Data mining extends statistics by combining:
- Machine Learning
- Artificial Intelligence
- Pattern Recognition
- Database Systems
- Probability Theory
- Optimization Algorithms
Instead of simply describing data, modern analytical methods discover hidden relationships that humans often overlook.
Definition 📖
Statistical Analysis is the science of collecting, organizing, analyzing, interpreting, and presenting data to support informed decision-making.
Data Mining is the computational process of automatically discovering useful patterns, trends, relationships, and knowledge from large datasets.
Together, they allow organizations to transform:
Raw Data ➜ Information ➜ Knowledge ➜ Better Decisions
Core Components of Statistical Analysis 🔍
Data Collection
Every successful project begins with reliable data.
Sources include:
- IoT sensors
- Databases
- Medical devices
- Manufacturing machines
- Financial systems
- Satellites
- Laboratory experiments
Good analysis always starts with high-quality data.
Data Cleaning
Real-world datasets usually contain:
- Missing values
- Duplicate records
- Incorrect measurements
- Noise
- Outliers
Cleaning improves accuracy before analysis begins.
Exploratory Data Analysis (EDA)
EDA helps engineers understand data through:
- Histograms
- Scatter plots
- Correlation matrices
- Box plots
- Heat maps
The goal is identifying patterns before building predictive models.
Statistical Modeling
Models describe relationships between variables.
Popular models include:
- Linear Regression
- Logistic Regression
- Time Series
- Bayesian Models
- Generalized Linear Models
Understanding Data Mining 🔬
Classification
Classification predicts predefined categories.
Examples:
- Spam detection
- Disease diagnosis
- Credit approval
- Quality inspection
Algorithms include:
- Decision Trees
- Random Forest
- Support Vector Machine
- Neural Networks
Clustering
Clustering groups similar observations without predefined labels.
Applications include:
- Customer segmentation
- Image processing
- Gene analysis
- Market research
Popular algorithms:
- K-Means
- DBSCAN
- Hierarchical Clustering
Association Rules
Association analysis discovers relationships between variables.
Example:
Customers buying:
- Bread
- Butter
may also purchase:
- Milk
The famous Apriori Algorithm performs this task.
Anomaly Detection
Detects unusual observations.
Engineering examples:
- Equipment failure
- Fraud detection
- Cyber attacks
- Manufacturing defects
Step-by-Step Statistical Analysis Workflow 🛠️
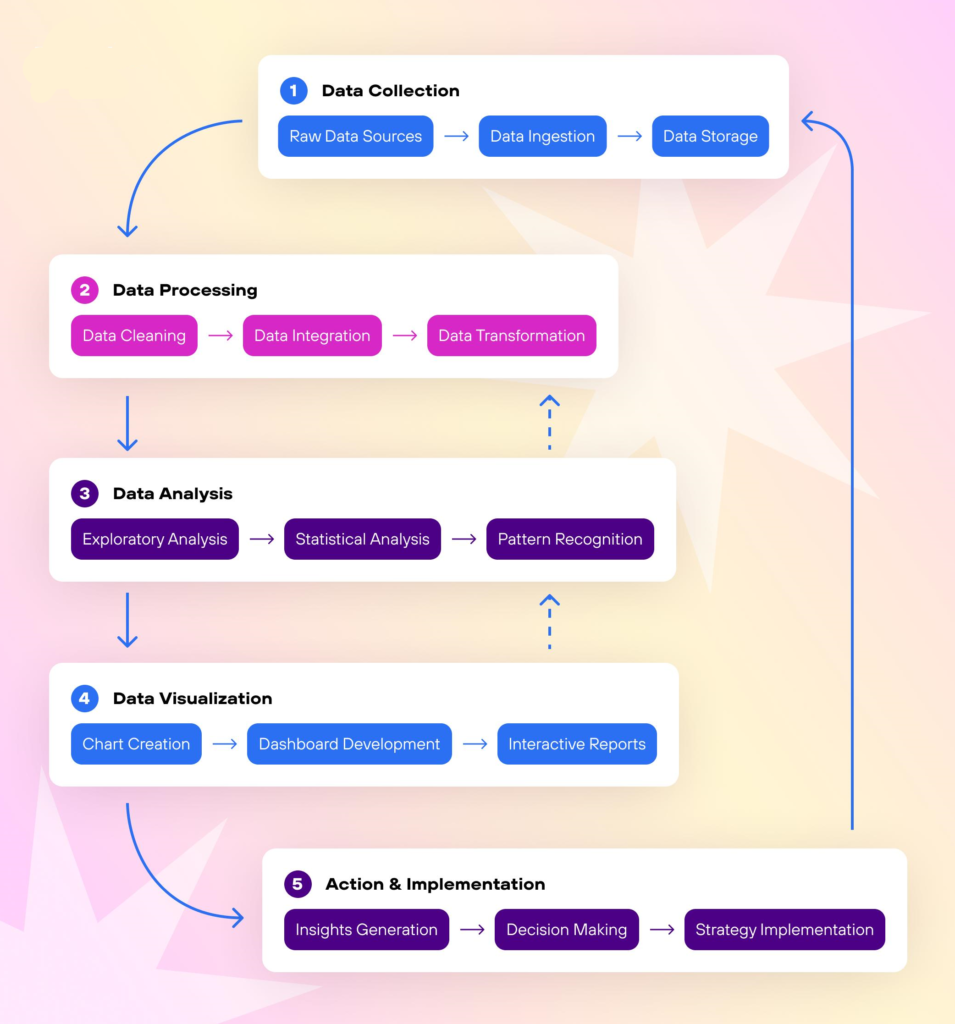


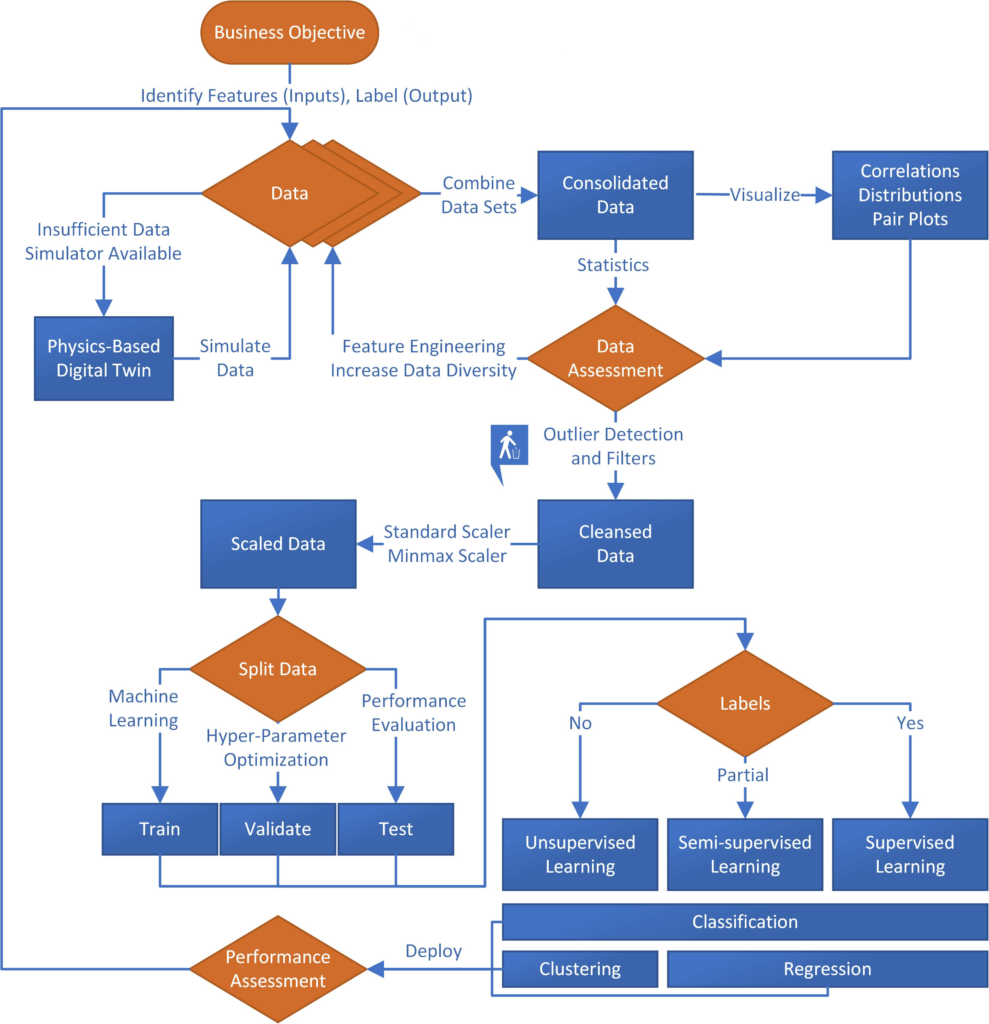


Step 1 — Define the Problem
Clearly identify:
- Objectives
- Variables
- Expected outcomes
Step 2 — Collect Data
Gather information from:
- Databases
- Sensors
- APIs
- Surveys
- Experiments
Step 3 — Clean the Dataset
Remove:
- Missing values
- Errors
- Inconsistent entries
Step 4 — Explore the Data
Use visualization tools to identify:
- Trends
- Correlations
- Distributions
Step 5 — Select Analytical Methods
Choose suitable techniques depending on:
- Prediction
- Classification
- Clustering
- Forecasting
Step 6 — Build Models
Train statistical or machine learning models.
Step 7 — Validate Results
Evaluate using:
- Accuracy
- Precision
- Recall
- RMSE
- Cross-validation
Step 8 — Deploy Findings
Use insights to support engineering decisions.
Statistical Analysis vs Data Mining ⚖️
| Feature | Statistical Analysis | Data Mining |
|---|---|---|
| Primary Goal | Explain relationships | Discover hidden patterns |
| Dataset Size | Small to Medium | Medium to Very Large |
| Mathematical Foundation | Strong | Strong + AI |
| Automation | Moderate | High |
| Machine Learning | Limited | Extensive |
| Predictive Capability | High | Very High |
| Business Intelligence | Yes | Yes |
| Big Data Support | Moderate | Excellent |
Important Statistical Techniques 📈
| Technique | Purpose |
|---|---|
| Mean | Central tendency |
| Median | Middle value |
| Standard Deviation | Data variability |
| Correlation | Relationship measurement |
| Regression | Prediction |
| ANOVA | Compare groups |
| Chi-Square | Categorical analysis |
| Hypothesis Testing | Scientific validation |
Popular Data Mining Algorithms 🤖
| Algorithm | Application |
|---|---|
| Decision Tree | Classification |
| Random Forest | Prediction |
| K-Means | Clustering |
| Apriori | Market Basket Analysis |
| Neural Networks | Deep Learning |
| XGBoost | High-performance prediction |
| Naive Bayes | Text classification |
| Support Vector Machine | Pattern recognition |
Software Used in Statistical Analysis 💻
| Software | Engineering Usage |
|---|---|
| Python | Machine Learning |
| R | Statistical Modeling |
| MATLAB | Numerical Analysis |
| SAS | Enterprise Analytics |
| SPSS | Academic Research |
| SQL | Data Management |
| Excel | Basic Statistics |
| Power BI | Visualization |
| Tableau | Business Intelligence |
Engineering Examples ⚙️
Manufacturing
Factories monitor:
- Temperature
- Pressure
- Vibration
- Energy consumption
Statistical models predict machine failures before they occur.
Healthcare
Hospitals analyze:
- Medical images
- Patient records
- Laboratory results
Machine learning improves diagnosis accuracy.
Transportation
Traffic systems analyze:
- GPS data
- Vehicle speeds
- Congestion levels
Results improve traffic management.
Energy
Power plants predict:
- Electricity demand
- Equipment maintenance
- Renewable energy production
Finance
Banks detect:
- Fraud
- Credit risk
- Investment opportunities
Real-World Applications 🌍
Statistical analysis and data mining support nearly every engineering discipline.
Examples include:
- ✈️ Aerospace engineering
- 🚗 Automotive manufacturing
- 🏗 Civil engineering
- ⚡ Electrical engineering
- 🤖 Robotics
- 🌐 Internet of Things
- 🏥 Biomedical engineering
- 📡 Telecommunications
- 🌦 Weather forecasting
- 🌱 Environmental monitoring
- 💳 Financial engineering
- 🛒 E-commerce recommendation systems
Common Mistakes ❌
Many beginners make avoidable errors.
Ignoring Data Quality
Poor data leads to inaccurate conclusions.
Overfitting Models
Models memorize training data instead of learning patterns.
Using Incorrect Statistical Tests
Every statistical method has assumptions.
Ignoring Correlation vs Causation
Correlation does not prove one variable causes another.
Small Sample Sizes
Insufficient data reduces model reliability.
Poor Feature Selection
Irrelevant variables decrease prediction accuracy.
Challenges and Solutions 🧩
| Challenge | Solution |
|---|---|
| Missing Data | Imputation techniques |
| Large Datasets | Distributed Computing |
| High Dimensions | PCA |
| Noise | Data Cleaning |
| Class Imbalance | Resampling |
| Model Complexity | Feature Engineering |
| Computational Cost | Parallel Processing |
| Data Security | Encryption & Access Control |
Case Study 🏭
Predictive Maintenance in Smart Manufacturing
A manufacturing company experienced unexpected failures in industrial motors.
Engineers installed IoT sensors measuring:
- Temperature
- Vibration
- Current
- Rotation speed
Over two years they collected millions of observations.
Using statistical analysis:
- Outliers were detected.
- Missing values were corrected.
- Correlations were identified.
Using machine learning:
- Random Forest predicted failures.
- Maintenance schedules became proactive.
- Downtime decreased significantly.
- Maintenance costs dropped.
- Production efficiency improved.
- Equipment lifespan increased.
This project demonstrates how combining statistical analysis with data mining creates measurable engineering value.
Essential Tips ⭐
✔ Always understand your data before modeling.
✔ Clean data carefully.
📊 Visualize data frequently.
✔ Validate every model.
✔ Document assumptions.
📊 Learn both statistics and machine learning.
✔ Practice using real datasets.
✔ Focus on interpretation rather than only accuracy.
📊 Understand business objectives.
✔ Continue learning new algorithms as technology evolves.
Frequently Asked Questions ❓
Is this handbook suitable for beginners?
Yes. While comprehensive, many concepts can be understood gradually with basic mathematics and programming knowledge.
Do I need programming experience?
Programming is highly recommended. Python and R are the most popular languages for statistical analysis and data mining.
Is statistics still important in the AI era?
Absolutely. Artificial Intelligence relies heavily on statistical principles for model development, validation, and interpretation.
Which engineering fields benefit the most?
Nearly every discipline, including civil, mechanical, electrical, aerospace, biomedical, industrial, software, and environmental engineering.
What datasets are commonly analyzed?
Sensor data, manufacturing records, medical information, financial transactions, customer behavior, scientific experiments, and IoT streams.
Which software should beginners learn first?
Python is often the best starting point because of its extensive libraries such as NumPy, pandas, SciPy, scikit-learn, and Matplotlib.
Can statistical analysis replace engineering judgment?
No. Statistical tools support decision-making, but engineering expertise remains essential for interpreting results and implementing practical solutions.
Conclusion 🎯
The Handbook of Statistical Analysis and Data Mining Applications represents far more than a reference book—it is a roadmap for transforming raw data into actionable engineering knowledge. By combining classical statistical methods with modern data mining techniques, engineers can solve complex problems, optimize systems, predict failures, improve quality, and support evidence-based decision-making across countless industries.
As organizations continue to generate ever-larger volumes of data, proficiency in statistical analysis, machine learning, and data mining will remain one of the most valuable skill sets for students and professionals alike. Whether your goal is designing smarter infrastructure, advancing healthcare, improving manufacturing efficiency, or developing intelligent software, mastering these analytical foundations will help you build innovative, reliable, and data-driven engineering solutions for the future.