Introduction to Statistical Methods for Financial Models 📊💹 | A Complete Engineering and Quantitative Finance Guide
Introduction 🚀
Financial markets generate enormous amounts of data every second. Stock prices fluctuate, interest rates change, currencies move, and investment portfolios continuously evolve. Behind every successful financial decision lies a set of statistical methods that help analysts, engineers, economists, and quantitative researchers understand uncertainty and predict future outcomes.
Statistical methods are the foundation of modern financial modeling. Whether developing a risk management framework, evaluating an investment opportunity, forecasting market behavior, or constructing an algorithmic trading strategy, statistics provides the mathematical tools needed to transform raw data into meaningful insights.
For engineering professionals entering quantitative finance, statistics serves as the bridge between mathematics and practical decision-making. Engineers are naturally skilled in analytical thinking, making statistical finance an attractive interdisciplinary field.
This article provides a comprehensive introduction to statistical methods used in financial models, covering both fundamental and advanced concepts suitable for students, engineers, analysts, and finance professionals.
Background Theory 📚
Why Statistics Matters in Finance
Financial systems operate under uncertainty. Unlike deterministic engineering systems where outputs can often be predicted precisely, financial markets involve numerous variables that interact in complex ways.
Statistical methods help answer questions such as:
- What is the probability of a stock price increasing?
- How risky is a particular investment?
- Can historical data predict future returns?
- How strongly are two assets related?
- What level of confidence exists in a forecast?
Without statistics, financial decisions would rely largely on intuition rather than evidence.
Historical Development
The relationship between statistics and finance dates back several centuries.
Early Probability Theory
The foundations emerged from probability studies by mathematicians investigating games of chance.
Important concepts developed included:
- Probability distributions
- Expected values
- Random variables
- Risk measurement
Modern Portfolio Theory
In the 1950s, Harry Markowitz introduced portfolio optimization using statistical variance and covariance.
This innovation transformed investment management by demonstrating how diversification reduces risk.
Quantitative Finance Revolution
The rise of computers enabled:
- Large-scale simulations
- High-frequency trading
- Machine learning models
- Risk analytics
- Financial forecasting
Today, statistical methods are integrated into nearly every financial institution worldwide.
Technical Definition ⚙️
Statistical methods for financial models refer to mathematical techniques used to collect, analyze, interpret, and predict financial data under uncertainty.
These methods are applied to:
| Area | Purpose |
|---|---|
| Risk Analysis | Measure uncertainty |
| Forecasting | Predict future prices |
| Portfolio Management | Optimize investments |
| Trading Systems | Generate signals |
| Credit Modeling | Assess borrower risk |
| Insurance | Estimate claim probabilities |
| Economics | Analyze market behavior |
A financial model typically uses historical data combined with statistical analysis to estimate future outcomes.
Core Statistical Concepts Used in Financial Models 📈
Random Variables
A random variable represents uncertain outcomes.
Examples:
- Daily stock return
- Interest rate movement
- Exchange rate fluctuation
- Commodity price change
Financial variables rarely remain constant.
Probability Distributions
Probability distributions describe how values are spread.
Normal Distribution
The most commonly used distribution in finance.
Characteristics:
✅ Bell-shaped curve
✅ Symmetrical
✅ Defined by mean and standard deviation
              *
           *     *
         *         *
       *             *
     *                 *
Many financial models assume returns follow a normal distribution.
Lognormal Distribution
Often used for:
- Stock prices
- Asset values
- Option pricing
Since asset prices cannot become negative, lognormal distributions are frequently preferred.
Mean (Average)
The mean represents the expected value.
Formula:
μ=∑X/N
Where:
- μ = mean
- X = observations
- N = number of observations
Example:
Returns:
5%, 7%, 8%, 10%
Mean return:
7.5%
Variance
Variance measures data dispersion.
A larger variance indicates greater uncertainty.
σ2=∑(X−μ)2/N
Higher variance generally means higher investment risk.
Standard Deviation
Standard deviation is the square root of variance.
It is one of the most important risk measures in finance.
| Investment | Standard Deviation |
|---|---|
| Treasury Bond | Low |
| Index Fund | Medium |
| Growth Stock | High |
| Cryptocurrency | Very High |
Step-by-Step Explanation of Statistical Modeling Process 🔍
Step 1: Define Financial Objective
Determine the purpose of the model.
Examples:
- Predict stock returns
- Estimate credit risk
- Measure portfolio volatility
- Forecast revenues
Step 2: Collect Data
Gather relevant financial data.
Sources may include:
- Market exchanges
- Company reports
- Economic databases
- Financial APIs
Examples:
- Stock prices
- Interest rates
- Inflation data
- Currency exchange rates
Step 3: Clean Data
Data quality significantly affects model accuracy.
Tasks include:
- Removing duplicates
- Handling missing values
- Correcting errors
- Standardizing formats
Step 4: Perform Descriptive Statistics
Calculate:
- Mean
- Median
- Mode
- Variance
- Standard deviation
These metrics summarize the dataset.
Step 5: Analyze Relationships
Determine connections between variables.
Methods include:
- Correlation
- Covariance
- Regression analysis
Step 6: Build Statistical Model
Examples:
- Linear Regression
- Logistic Regression
- Time Series Models
- Monte Carlo Simulations
Step 7: Validate Results
Validation ensures reliability.
Methods include:
- Backtesting
- Cross-validation
- Error measurement
Step 8: Deploy and Monitor
Financial models require continuous monitoring because markets evolve over time.
Important Statistical Techniques in Financial Models 📊
Correlation Analysis
Correlation measures how two variables move together.
Range:
- +1 = Perfect positive relationship
- 0 = No relationship
- -1 = Perfect negative relationship
Example:
| Asset Pair | Correlation |
|---|---|
| Oil & Energy Stocks | 0.80 |
| Gold & Stocks | -0.20 |
| Two Technology Stocks | 0.90 |
Covariance
Covariance evaluates directional movement between variables.
Positive covariance:
⬆ Asset A → Asset B tends to rise
Negative covariance:
⬆ Asset A → Asset B tends to fall
Regression Analysis
Regression predicts one variable using another.
Linear Regression Model
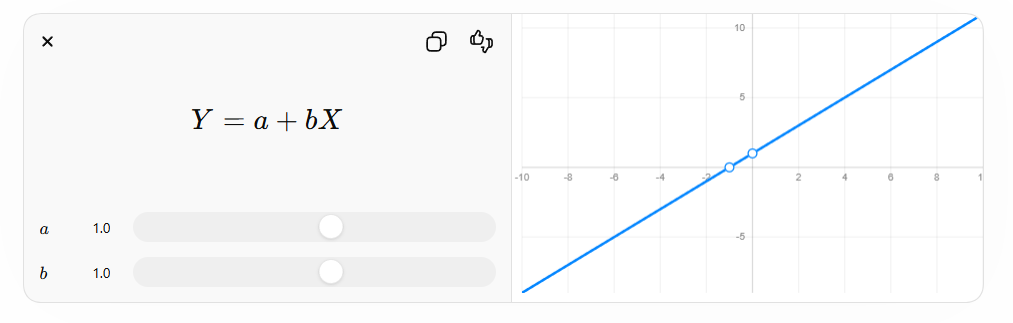
Where:
- Y = dependent variable
- X = independent variable
- a = intercept
- b = slope
Applications:
- Stock prediction
- Revenue forecasting
- Economic analysis
Hypothesis Testing
Used to determine whether observed patterns are statistically significant.
Common tests:
- Z-test
- T-test
- Chi-square test
- ANOVA
Example:
Testing whether a new trading strategy outperforms the market.
Time Series Analysis
Financial data is time-dependent.
Techniques include:
- Moving averages
- Exponential smoothing
- ARIMA models
- Seasonal decomposition
Applications:
Stock forecasting
Economic forecasting
Demand planning
Monte Carlo Simulation 🎲
Monte Carlo methods generate thousands of possible future scenarios.
Example:
Simulating future stock prices:
Scenario 1 → Profit
Scenario 2 → Loss
Scenario 3 → Profit
...
Scenario 10,000
Benefits:
Risk estimation
Portfolio optimization
Option valuation
Comparison of Major Statistical Methods ⚖️
| Method | Purpose | Complexity | Accuracy |
|---|---|---|---|
| Mean Analysis | Basic estimation | Low | Low |
| Correlation | Relationship analysis | Low | Medium |
| Regression | Prediction | Medium | High |
| Time Series | Forecasting | Medium | High |
| Monte Carlo | Risk modeling | High | Very High |
| Machine Learning | Pattern discovery | Very High | Very High |
Financial Modeling Data Table Example 📋
Monthly Stock Returns
| Month | Return (%) |
|---|---|
| January | 3.1 |
| February | -1.2 |
| March | 4.5 |
| April | 2.8 |
| May | -0.5 |
| June | 5.2 |
Summary Statistics:
| Metric | Value |
|---|---|
| Mean | 2.32% |
| Maximum | 5.2% |
| Minimum | -1.2% |
| Range | 6.4% |
Examples of Statistical Methods in Action 💡
Example 1: Portfolio Risk
An investor owns:
- 40% Technology Stocks
- 30% Bonds
- 30% Energy Stocks
Using:
- Variance
- Covariance
- Correlation
The portfolio’s overall risk can be estimated.
Example 2: Loan Default Prediction
A bank evaluates:
- Income
- Credit Score
- Employment History
- Debt Ratio
Using logistic regression, the probability of default is estimated.
Example 3: Stock Price Forecasting
Historical stock prices are analyzed using:
- Moving averages
- Regression
- Time-series forecasting
The model predicts potential future values.
Real-World Applications 🌍
Investment Banking
Used for:
- Asset valuation
- Risk analysis
- Mergers and acquisitions
Hedge Funds
Statistical models support:
- Algorithmic trading
- Arbitrage opportunities
- Market forecasting
Insurance Industry
Applications include:
- Claim forecasting
- Premium calculation
- Catastrophe modeling
FinTech Platforms
Modern FinTech systems rely on statistics for:
- Fraud detection
- Customer scoring
- Personalized investment advice
Central Banks
Statistical analysis helps:
- Control inflation
- Monitor financial stability
- Forecast economic growth
Common Mistakes ❌
Overfitting
A model learns historical noise rather than useful patterns.
Symptoms:
- Excellent historical performance
- Poor future performance
Ignoring Outliers
Extreme values can significantly distort results.
Examples:
- Market crashes
- Economic shocks
- Financial crises
Assuming Correlation Means Causation
Just because two variables move together does not mean one causes the other.
Example:
Ice cream sales and stock prices may both rise during summer, but one does not cause the other.
Small Sample Sizes
Insufficient data often produces unreliable conclusions.
Blindly Trusting Historical Data
Markets evolve.
Past performance never guarantees future results.
Challenges and Solutions 🛠️
Challenge 1: Market Volatility
Problem:
Unexpected price movements.
Solution:
- Dynamic models
- Frequent recalibration
- Monte Carlo simulations
Challenge 2: Data Quality
Problem:
Incomplete or inaccurate datasets.
Solution:
- Data validation
- Cleaning procedures
- Automated quality checks
Challenge 3: Model Complexity
Problem:
Complex models become difficult to interpret.
Solution:
- Balance simplicity and accuracy
- Document assumptions
- Use explainable models
Challenge 4: Computational Cost
Problem:
Large datasets require substantial computing resources.
Solution:
- Cloud computing
- Parallel processing
- Efficient algorithms
Case Study 🏦
Portfolio Risk Assessment Using Statistical Methods
A financial institution manages a portfolio worth $500 million.
Objectives:
- Reduce risk
- Maintain target returns
Data Collection
Five years of historical data gathered for:
- Stocks
- Bonds
- Commodities
Statistical Analysis
Calculated:
- Mean returns
- Variances
- Correlations
Model Construction
Portfolio optimization model created using:
- Expected returns
- Covariance matrix
- Risk constraints
Results
Outcomes included:
18% reduction in volatility
Improved diversification
More stable long-term returns
This demonstrates how statistical techniques directly influence financial performance.
Tips for Engineers Entering Financial Modeling 👨💻👩💻
Learn Probability Thoroughly
Probability forms the foundation of quantitative finance.
Focus on:
- Random variables
- Distributions
- Bayesian thinking
Master Data Analysis Tools
Popular tools include:
- Python
- R
- MATLAB
- SQL
- Excel
Understand Financial Markets
Study:
- Equities
- Bonds
- Derivatives
- Commodities
- Foreign Exchange
Build Projects
Examples:
- Stock forecasting model
- Risk calculator
- Portfolio optimizer
- Monte Carlo simulator
Validate Everything
Engineering principles apply equally in finance:
Measure
Test
Verify
Improve
Never assume a model is correct without evidence.
Frequently Asked Questions (FAQs) ❓
What are statistical methods in financial models?
They are mathematical techniques used to analyze financial data, measure risk, forecast outcomes, and support decision-making under uncertainty.
Why is statistics important in finance?
Statistics helps transform raw market data into actionable insights while quantifying uncertainty and risk.
Which statistical measure is most commonly used for risk?
Standard deviation is one of the most widely used measures of investment risk.
What is regression analysis used for?
Regression identifies relationships between variables and helps predict future outcomes.
What is Monte Carlo simulation?
It is a computational technique that generates thousands of possible future scenarios to evaluate risk and uncertainty.
Can statistical models predict stock prices perfectly?
No. Financial markets contain uncertainty, and no statistical model can guarantee perfect predictions.
Which programming language is best for financial statistics?
Python is currently one of the most popular choices because of libraries such as NumPy, Pandas, SciPy, Statsmodels, and Scikit-learn.
Is financial modeling suitable for engineers?
Yes. Engineers possess strong analytical and mathematical skills that translate exceptionally well into quantitative finance and financial modeling.
Conclusion 🎯
Statistical methods form the backbone of modern financial modeling. From measuring portfolio risk and forecasting stock prices to detecting fraud and optimizing investments, statistics enables data-driven financial decision-making. Concepts such as probability distributions, variance, standard deviation, correlation, regression analysis, hypothesis testing, time-series forecasting, and Monte Carlo simulation provide the framework for understanding uncertainty in financial systems.
For both students and professional engineers, mastering statistical techniques opens opportunities in quantitative finance, investment management, banking, insurance, FinTech, and data science. As financial markets continue to generate increasing volumes of data, the importance of statistical modeling will only grow. Those who combine engineering problem-solving skills with statistical expertise will be well-positioned to build robust financial models, make informed decisions, and contribute to the future of data-driven finance. 📊🚀💰


