Applied Linear Statistical Models 5th Edition: The Complete Engineering Guide to Statistical Modeling, Data Analysis, and Decision-Making 📊⚙️📈
Introduction 🚀
Modern engineering relies heavily on data-driven decision-making. Whether designing bridges, optimizing manufacturing systems, improving software performance, analyzing environmental conditions, or developing machine learning models, engineers need reliable statistical tools to understand relationships between variables and make informed decisions.
Among the most respected resources in statistical modeling is Applied Linear Statistical Models 5th Edition, a comprehensive text that provides a practical and theoretical foundation for linear statistical analysis. The book has become a standard reference in engineering, science, business analytics, quality control, and research methodology.
Linear statistical models help engineers answer questions such as:
✅ Which factors affect product quality?
✅ How can process performance be predicted?
📊 Which variables significantly influence system behavior?
✅ How can uncertainty be quantified?
✅ What is the best model for forecasting future outcomes?
The power of linear statistical models lies in their ability to transform raw observations into meaningful insights. They provide mathematical frameworks for understanding patterns, testing hypotheses, and optimizing complex systems.
This article explores the concepts, methods, applications, advantages, limitations, and practical engineering relevance of Applied Linear Statistical Models 5th Edition in a detailed yet accessible manner.
Background Theory 📚
Statistics is fundamentally concerned with extracting information from data. In engineering and scientific research, data often contain variability caused by:
- Measurement errors
- Environmental conditions
- Manufacturing variations
- Human factors
- System uncertainty
Linear statistical models emerged as a structured approach for studying these variations.
Historical Development 🕰️
The foundations of linear models can be traced back to pioneering mathematicians and statisticians such as:
- Carl Friedrich Gauss
- Pierre-Simon Laplace
- Ronald A. Fisher
Their work introduced concepts such as:
- Least squares estimation
- Experimental design
- Analysis of variance
- Regression analysis
Over time, these methods evolved into the modern framework of applied linear statistical modeling.
Why Engineers Need Statistical Models 🔬
Engineering systems rarely behave perfectly.
Examples include:
- Machine vibrations
- Structural stress fluctuations
- Sensor noise
- Material property variation
- Manufacturing tolerances
Linear models provide mechanisms to:
- Identify significant factors
- Estimate system parameters
- Predict outcomes
- Improve reliability
- Support optimization efforts
Technical Definition ⚙️
A linear statistical model expresses a response variable as a linear combination of predictor variables plus random error.
The general linear model can be represented as:
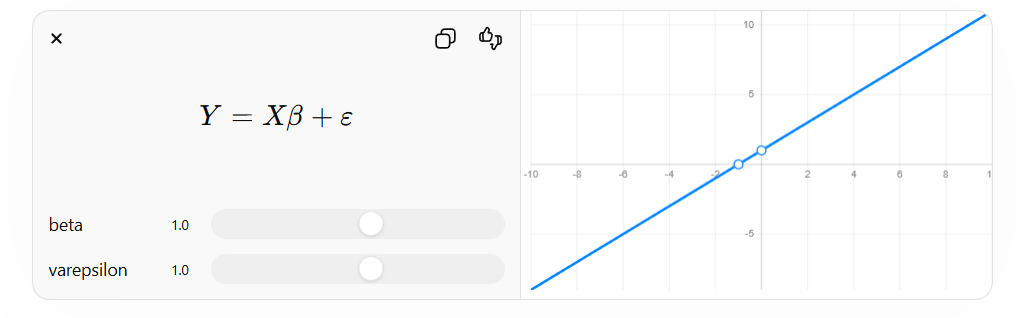
Where:
| Symbol | Meaning |
|---|---|
| Y | Response variable |
| X | Design matrix |
| β | Unknown parameters |
| ε | Random error |
The model assumes:
- Linearity
- Independence
- Constant variance
- Normally distributed errors
These assumptions allow reliable estimation and inference.
Key Components
Response Variable
The outcome being studied.
Examples:
- Strength of concrete
- Product defect rate
- Fuel consumption
- Temperature
Predictor Variables
Factors believed to influence the response.
Examples:
- Pressure
- Speed
- Material composition
- Operating temperature
Error Term
Represents unexplained variability.
No model perfectly captures reality, making the error term essential.
Step-by-Step Explanation 🔍
Understanding linear statistical models becomes easier when approached systematically.
Step 1: Define the Problem
Clearly identify:
- Objective
- Response variable
- Potential predictors
Example:
Predict energy consumption based on:
- Temperature
- Humidity
- Occupancy
Step 2: Collect Data 📋
Reliable conclusions require quality data.
Important considerations:
- Sample size
- Measurement accuracy
- Data consistency
- Experimental design
Step 3: Explore the Data 📈
Engineers should examine:
- Histograms
- Scatter plots
- Correlation matrices
- Summary statistics
This helps identify trends and anomalies.
Step 4: Build the Model 🏗️
A simple linear regression model may take the form:
y=β0+β1x+ε
Where:
- β₀ = intercept
- β₁ = slope
Step 5: Estimate Parameters
The most common method is Least Squares Estimation.
Goal:
Minimize the sum of squared residuals.
Step 6: Evaluate Model Quality
Common metrics include:
| Metric | Purpose |
|---|---|
| R² | Explained variation |
| Adjusted R² | Complexity-adjusted fit |
| RMSE | Prediction error |
| p-value | Significance test |
Step 7: Validate Assumptions
Engineers should verify:
✅ Residual normality
✅ Constant variance
📊 Independence
✅ No severe multicollinearity
Step 8: Make Predictions
Once validated, the model can support:
- Forecasting
- Optimization
- Quality improvement
- Decision-making
Comparison 📊
Simple vs Multiple Linear Regression
| Feature | Simple Regression | Multiple Regression |
|---|---|---|
| Predictors | One | Multiple |
| Complexity | Low | Moderate |
| Accuracy | Lower | Higher |
| Interpretation | Easy | More complex |
| Applications | Basic studies | Real engineering systems |
Regression vs ANOVA
| Aspect | Regression | ANOVA |
|---|---|---|
| Purpose | Prediction | Group comparison |
| Inputs | Continuous variables | Categorical variables |
| Output | Equation | Variance decomposition |
| Engineering Use | Modeling systems | Process comparisons |
Classical vs Modern Machine Learning
| Aspect | Linear Models | Machine Learning |
|---|---|---|
| Interpretability | High | Often low |
| Computational Cost | Low | High |
| Data Requirement | Moderate | Large |
| Transparency | Excellent | Variable |
| Engineering Adoption | Very High | Growing |
Diagrams & Tables 📐
Linear Modeling Workflow
Data Collection
       │
       ▼
Data Cleaning
       │
       ▼
Exploratory Analysis
       │
       ▼
Model Construction
       │
       ▼
Parameter Estimation
       │
       ▼
Validation
       │
       ▼
Prediction
       │
       ▼
Decision Making
Model Components
Predictor Variables
      │
      ▼
Linear Model
      │
      ▼
Predicted Response
      │
      ▼
Residual Analysis
      │
      ▼
Model Improvement
Examples 🧮
Example 1: Manufacturing Quality
An engineer studies product strength.
Predictors:
- Temperature
- Pressure
Response:
- Tensile strength
After fitting a model, the engineer finds:
- Temperature significantly affects strength.
- Pressure has moderate influence.
Result:
Improved production settings.
Example 2: Civil Engineering
Objective:
Predict bridge deflection.
Inputs:
- Load
- Span length
- Material properties
Linear regression identifies the most influential variables.
Benefits:
- Better safety evaluation
- Improved design decisions
Example 3: Software Engineering 💻
Predict application response time.
Variables:
- CPU usage
- Memory usage
- Network traffic
Linear models reveal bottlenecks.
Outcome:
Performance optimization.
Real World Application 🌍
Applied Linear Statistical Models are used across numerous engineering disciplines.
Mechanical Engineering ⚙️
Applications include:
- Failure prediction
- Fatigue analysis
- Process optimization
Civil Engineering 🏗️
Applications include:
- Structural reliability
- Material testing
- Traffic modeling
Electrical Engineering ⚡
Applications include:
- Signal analysis
- Power forecasting
- System reliability
Chemical Engineering 🧪
Applications include:
- Process control
- Reaction optimization
- Yield prediction
Environmental Engineering 🌱
Applications include:
- Pollution monitoring
- Climate studies
- Water quality analysis
Industrial Engineering 🏭
Applications include:
- Six Sigma projects
- Quality control
- Supply chain optimization
Data Science and AI 🤖
Linear statistical models remain essential because:
- 📊They are interpretable.
- They provide baseline performance.
- They support explainable AI initiatives.
Common Mistakes ❌
Engineers frequently encounter errors when applying linear models.
Ignoring Assumptions
Many analyses fail because assumptions are never checked.
Small Sample Sizes
Insufficient data often produces unreliable estimates.
Multicollinearity
Highly correlated predictors create unstable coefficients.
Overfitting
Adding unnecessary variables can reduce predictive performance.
Confusing Correlation and Causation
Correlation does not automatically imply causality.
This mistake can lead to poor engineering decisions.
Poor Data Quality
Even sophisticated models fail when data are inaccurate.
Challenges & Solutions 🛠️
Challenge 1: Missing Data
Problem:
Incomplete observations.
Solution:
- Imputation techniques
- Data collection improvements
Challenge 2: Outliers
Problem:
Extreme values distort results.
Solution:
- Robust analysis
- Outlier investigation
Challenge 3: Nonlinear Relationships
Problem:
Linear assumptions may not hold.
Solution:
- Variable transformation
- Polynomial regression
Challenge 4: Large Numbers of Variables
Problem:
Model complexity increases.
Solution:
- Feature selection
- Principal component analysis
Challenge 5: Dynamic Systems
Problem:
Relationships change over time.
Solution:
- Continuous monitoring
- Model updates
Case Study 🏆
Manufacturing Process Optimization
A manufacturing company experiences inconsistent product quality.
Objective
Reduce defects while maintaining production speed.
Data Collected
Variables:
- Temperature
- Pressure
- Machine speed
- Operator shift
Response:
- Defect percentage
Analysis
Engineers use multiple linear regression.
Findings:
- Temperature strongly affects quality.
- Excessive speed increases defects.
- Pressure contributes moderately.
Actions Taken
The company:
- Optimized temperature settings.
- Reduced excessive machine speed.
- Standardized operating procedures.
Results
After implementation:
📈 Defects reduced by 28%
📈 Production consistency improved
📊 Customer complaints decreased
📈 Manufacturing costs declined
This demonstrates how applied linear statistical models generate measurable business value.
Tips for Engineers 💡
Focus on Data Quality
Better data leads to better models.
Understand the Process
Domain knowledge is as important as statistics.
Validate Every Model
Never assume a model is correct without testing.
Visualize Results
Graphs often reveal issues hidden in tables.
Keep Models Simple
Simple models are usually easier to maintain and explain.
Document Assumptions
Future engineers should understand:
- Data sources
- Modeling choices
- Limitations
Learn Statistical Software
Useful tools include:
- R
- MATLAB
- Minitab
- Python
- SAS
Frequently Asked Questions ❓
What is Applied Linear Statistical Models 5th Edition?
It is a comprehensive textbook covering regression analysis, analysis of variance, experimental design, and linear statistical modeling methods widely used in engineering and scientific research.
Who should study this book?
The book is valuable for:
- Engineering students
- Graduate researchers
- Data analysts
- Scientists
- Industry professionals
Is advanced mathematics required?
A background in:
- Algebra
- Calculus
- Basic statistics
is helpful, though many concepts can be learned progressively.
Why are linear models still important today?
They remain important because they are:
- Interpretable
- Reliable
- Efficient
- Widely accepted in industry
How do linear models relate to machine learning?
Many machine learning algorithms build upon concepts introduced in linear statistical modeling, including regression, optimization, and prediction.
What industries use these methods?
Industries include:
- Aerospace
- Manufacturing
- Healthcare
- Energy
- Finance
- Transportation
- Telecommunications
What is the biggest benefit of linear models?
Their ability to explain relationships clearly while providing accurate predictions.
Can linear models handle large datasets?
Yes. Modern computing systems can efficiently process large datasets using linear modeling techniques.
Conclusion 🎯
Applied Linear Statistical Models 5th Edition remains one of the most influential resources for understanding statistical modeling in engineering, science, and industry. Its framework provides a rigorous yet practical approach to analyzing data, estimating relationships, validating assumptions, and supporting evidence-based decisions.
From manufacturing optimization and structural engineering to environmental monitoring and artificial intelligence, linear statistical models continue to serve as foundational tools for solving real-world problems. Their combination of mathematical rigor, interpretability, computational efficiency, and practical relevance makes them indispensable for both students and experienced professionals.
As organizations increasingly rely on data-driven strategies, mastering the concepts presented in Applied Linear Statistical Models 5th Edition equips engineers with the analytical skills needed to transform raw data into actionable insights, improve system performance, reduce uncertainty, and drive innovation. 📊⚙️🚀
By understanding the theory, applying the methods correctly, avoiding common mistakes, and continuously validating results, engineers can leverage linear statistical models to make smarter decisions and create more reliable, efficient, and successful engineering solutions. 🌟📈🔬


