An Introduction to R and Python for Data Analysis: A Side-by-Side Approach
Introduction
Data analysis has become a fundamental engineering and technical skill. From evaluating sensor measurements and predicting equipment performance to studying business data and building intelligent systems, engineers increasingly need programming tools that can transform raw information into useful decisions. Two of the most important choices are R and Python.
R was designed with statistics and data analysis at its core, while Python evolved into a broad-purpose programming language with a powerful ecosystem for data science, automation, machine learning, and engineering applications. Both can clean datasets, create visualizations, perform statistical analysis, and support advanced predictive workflows—but they approach these tasks differently.
For students, the question is often: Which language should I learn first? For professionals, the more useful question may be: Which tool is better for this particular analytical problem?
This side-by-side guide examines R and Python from an engineering and data-analysis perspective. It explains their foundations, workflows, strengths, limitations, practical applications, and the situations in which one may be preferable to the other.


Background Theory
Why programming matters in data analysis
Traditional data analysis can involve spreadsheets, calculators, specialized engineering software, or statistical packages. These tools remain useful, but programming provides something particularly valuable: repeatability.
Instead of manually processing the same dataset every month, an engineer can create a workflow that:
- Imports new measurements.
- Checks data quality.
- Removes or flags problematic observations.
- Transforms variables.
- Produces statistical summaries.
- Creates charts.
- Generates reports.
- Feeds results into predictive models.
This converts analysis from a one-time activity into a reproducible process.
R and Python emerged from different backgrounds
R was developed primarily around statistical computing and graphical analysis. Its ecosystem contains an enormous collection of statistical techniques and specialized packages.
Python was designed as a general-purpose programming language. Its simplicity and flexibility later made it extremely popular for scientific computing, machine learning, artificial intelligence, automation, and data engineering.
This historical difference still influences their ecosystems today.
The modern overlap
The boundary between R and Python is no longer rigid.
R can be used for:
- Machine learning
- Web applications
- Data engineering
- Interactive dashboards
- Automation
Python can be used for:
- Statistical testing
- Regression
- Experimental analysis
- Data visualization
- Scientific computing
Therefore, the decision should not be based simply on the idea that “R is for statistics and Python is for programming.” Modern ecosystems are much more interconnected.
Definition
What is R?
R is an open-source programming language and computing environment focused heavily on statistics, data analysis, visualization, and research.
Its strengths include statistical modeling, exploratory analysis, visualization, and specialized analytical packages.
R is particularly attractive when an engineering or research workflow requires sophisticated statistical investigation and publication-quality analytical graphics.
What is Python?
Python is a general-purpose, high-level programming language widely used for software development, automation, scientific computing, data analysis, artificial intelligence, and machine learning.
Its data-analysis ecosystem includes widely adopted libraries such as:
- NumPy
- pandas
- Matplotlib
- SciPy
- scikit-learn
- PyTorch
- TensorFlow
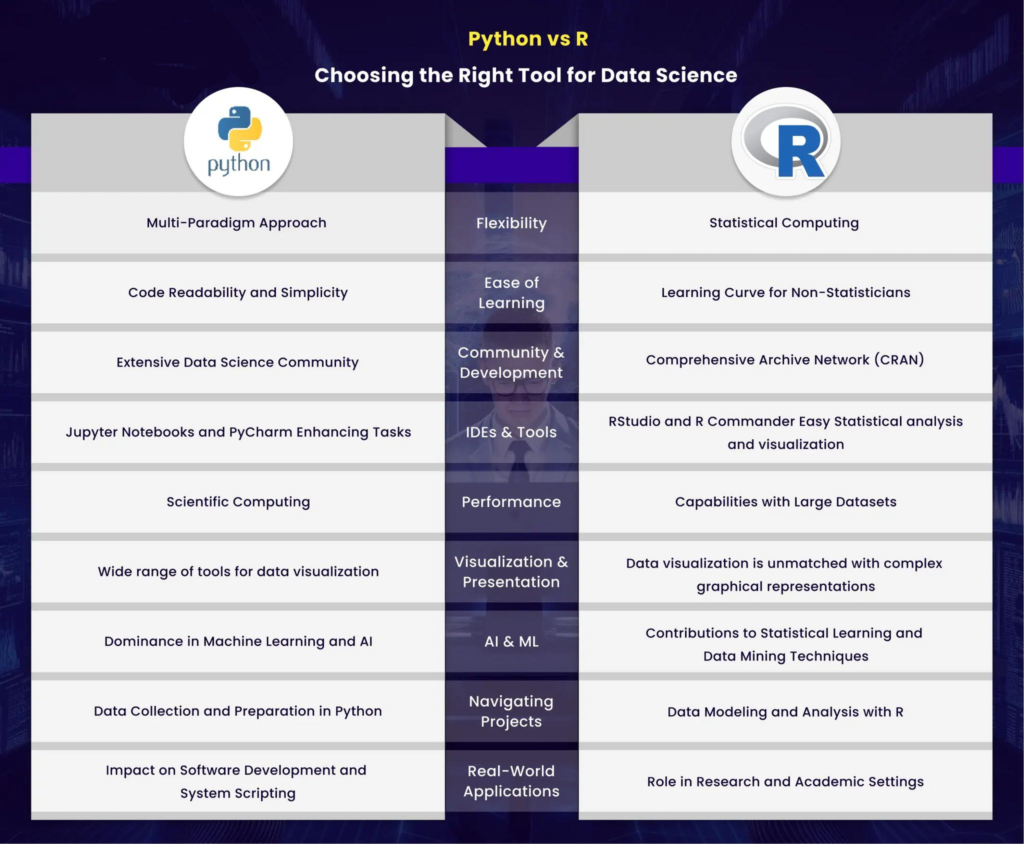
R vs Python at a glance
| Feature | R | Python |
|---|---|---|
| Primary historical focus | Statistics | General-purpose programming |
| Data analysis | Excellent | Excellent |
| Statistical research | Excellent | Very strong |
| Machine learning | Very strong | Excellent |
| AI development | Good | Excellent |
| Visualization | Excellent | Excellent |
| Automation | Good | Excellent |
| Software development | Moderate | Excellent |
| Learning curve | Moderate | Beginner-friendly |
| Engineering integration | Good | Excellent |
| Research workflows | Excellent | Excellent |
| Data engineering | Moderate | Excellent |
Step-by-Step Explanation: R and Python Data Analysis Workflow
A useful way to compare R and Python is to follow the same analytical workflow using both languages.


Step 1: Define the analytical problem
Before writing code, determine what needs to be discovered.
For example, an engineer may want to investigate whether machine temperature, vibration, and operating time are associated with equipment failures.
The first question is not:
“Should I use R or Python?”
It is:
“What information do I need to extract from the data?”
Step 2: Collect the data
Data may originate from:
- Sensors
- Laboratory experiments
- CSV files
- Databases
- APIs
- Manufacturing systems
- Survey systems
- Simulation software
- IoT devices
Python is particularly strong when data collection needs to be connected with APIs, databases, automation, or software systems.
R is highly effective when the data has already been collected and the primary objective is statistical analysis.
Step 3: Inspect the dataset
The next stage involves understanding the structure of the data.
An analyst should examine:
- Number of observations
- Variables
- Data types
- Missing values
- Duplicate records
- Extreme observations
- Measurement ranges
- Relationships between variables
Both R and Python provide powerful tools for this process.
Step 4: Clean the data
Real-world engineering data is rarely perfect.
A dataset may contain:
- Missing sensor readings
- Incorrect units
- Duplicate measurements
- Impossible values
- Timestamp problems
- Typographical errors
- Inconsistent categories
R and Python can both automate these cleaning operations.
Step 5: Explore the data
Exploratory data analysis helps reveal patterns before formal modeling begins.
Useful visualizations include:
- Histograms
- Scatter plots
- Box plots
- Line charts
- Heatmaps
- Distribution plots
- Time-series graphs
R has an especially strong reputation for statistical visualization through its modern visualization ecosystem.
Python offers similarly powerful visualization capabilities and has the additional advantage of fitting naturally into larger software and machine-learning workflows.
Step 6: Perform statistical analysis
Depending on the problem, an analyst might investigate:
- Correlations
- Distributions
- Relationships between variables
- Regression models
- Hypothesis tests
- Experimental results
- Time-series behavior
- Uncertainty
R has traditionally been extremely strong in this area.
Python can also perform sophisticated statistical analysis through libraries such as SciPy and statsmodels.
Step 7: Build predictive models
When the objective moves from “What happened?” toward “What is likely to happen?”, machine learning may become useful.
Python has a particularly broad ecosystem for:
- Classification
- Regression
- Clustering
- Deep learning
- Natural language processing
- Computer vision
- Reinforcement learning
R also supports machine learning extensively, especially for structured statistical datasets.
Step 8: Communicate the results
The final stage is often overlooked.
A technically correct analysis has limited value if decision-makers cannot understand it.
Both languages can produce:
- Reports
- Charts
- Dashboards
- Interactive applications
- Automated outputs
R is particularly attractive for research reports and statistical communication, while Python is highly useful when analytical results must become part of a larger software system.
Comparison


Learning experience
Python is generally easier for beginners who want to develop broad programming skills. Its syntax is relatively readable, and the same language can be used for automation, web development, data analysis, and machine learning.
R can feel unusual at first because its design is strongly influenced by statistical computing.
For someone whose objective is primarily statistical research, however, R’s analytical style can become very productive.
Data manipulation
Both languages are excellent for manipulating structured data.
Python’s pandas library provides a powerful tabular-data environment.
R’s data manipulation ecosystem is exceptionally expressive and popular among statisticians and researchers.
The choice often comes down to personal preference and the surrounding workflow.
Visualization
R has a major advantage in specialized statistical visualization and exploratory graphics.
Python provides an equally broad visualization ecosystem, especially when combined with scientific and machine-learning workflows.
The best choice depends on the required chart type, reporting system, and team expertise.
Machine learning
Python generally has the stronger position for modern machine learning and AI development.
It integrates naturally with:
- Deep-learning frameworks
- GPU computing
- Production APIs
- Computer vision
- Natural language processing
- Model deployment
R remains highly capable for conventional machine learning and statistical modeling.
Automation and software integration
Python is usually the stronger choice when analysis must become part of a larger engineering system.
For example, Python can collect sensor data, process it, run a predictive model, store the results, and communicate with another application.
R can perform automation as well, but Python’s general-purpose architecture gives it an advantage in many production environments.
Diagrams & Tables
Typical analytical pipeline
Raw Data
   ↓
Data Collection
   ↓
Data Validation
   ↓
Data Cleaning
   ↓
Exploratory Analysis
   ↓
Statistical Modeling
   ↓
Machine Learning
   ↓
Visualization
   ↓
Engineering Decision
Choosing between R and Python
| Requirement | Preferred Choice |
|---|---|
| Statistical research | R |
| Beginner programming | Python |
| Data visualization | R / Python |
| Machine learning | Python |
| Deep learning | Python |
| Academic statistics | R |
| Automation | Python |
| Engineering software integration | Python |
| Interactive statistical reporting | R |
| Large AI projects | Python |
| Experimental analysis | R |
| General-purpose development | Python |
Examples
Example 1: Manufacturing quality
Imagine a manufacturing company collecting information about product dimensions, temperature, pressure, production speed, and defect status.
An analyst could use R to investigate which process variables are statistically associated with defects and create detailed analytical graphics.
Python could then be used to integrate the resulting model into a production monitoring system.
Example 2: Predictive maintenance
A machine produces thousands of vibration and temperature measurements.
Python could automatically:
- Collect sensor data.
- Organize measurements.
- Detect abnormal patterns.
- Run a predictive model.
- Send an alert to an engineering dashboard.
R could also perform the analysis, particularly when the primary goal is statistical investigation of failure patterns.
Example 3: Research experiment
An engineering researcher conducts hundreds of laboratory experiments.
R may provide an excellent environment for:
- Statistical summaries
- Experimental comparisons
- Model interpretation
- Visualization
- Research reporting
Python can perform the same analytical tasks and becomes particularly attractive if the researcher later wants to integrate the model into an automated application.
Real-World Application
Civil and structural engineering
Engineers can analyze:
- Structural monitoring data
- Material test results
- Construction measurements
- Traffic patterns
- Environmental observations
Python can connect directly with databases, sensors, simulations, and engineering applications.
R is useful for statistical investigation, uncertainty analysis, experimental data, and research visualization.
Mechanical engineering
Mechanical engineers can use both languages for:
- Predictive maintenance
- Failure analysis
- Energy monitoring
- Manufacturing optimization
- Sensor-data analysis
Python is especially valuable when analysis is combined with automation or machine learning.
Electrical engineering
Applications include:
- Signal analysis
- Power-quality monitoring
- Fault detection
- Load forecasting
- IoT systems
Python’s scientific ecosystem makes it particularly useful for integrated engineering workflows.
Environmental engineering
Engineers can process:
- Air-quality measurements
- Water-quality data
- Weather observations
- Pollution records
- Environmental sensor streams
R can be highly effective for statistical environmental studies, while Python can facilitate automated data pipelines.
Common Mistakes
Choosing a language before defining the problem
A programming language should serve the analytical objective.
Choosing Python simply because it is popular—or R simply because it is associated with statistics—can produce unnecessary limitations.
Learning syntax without learning data analysis
Knowing commands is not the same as understanding data.
Students should learn concepts such as:
- Data quality
- Sampling
- Bias
- Variability
- Correlation
- Statistical significance
- Model validation
Ignoring visualization
A table containing thousands of numbers rarely reveals patterns efficiently.
Good visualization can expose anomalies, trends, clusters, and relationships that are difficult to detect from raw data.
Treating correlation as proof of causation
Two variables can move together without one directly causing the other.
Engineers should combine statistical analysis with domain knowledge and experimental reasoning.
Creating models without validating them
A model can perform extremely well on historical data and still perform poorly on new observations.
Validation is essential.
Challenges & Solutions
Challenge: Too many libraries
Both ecosystems contain thousands of packages and libraries.
Solution: Begin with a small core toolkit and expand gradually.
For Python, a beginner can start with NumPy, pandas, Matplotlib, and scikit-learn.
For R, learners can focus on the core language and a small collection of widely used data-analysis and visualization packages.
Challenge: Reproducibility
Manual analysis makes it difficult for another engineer to reproduce the result.
Solution: Keep data-processing and analytical operations inside documented scripts or notebooks.
Challenge: Performance
Large datasets may become computationally expensive.
Solution: Optimize the workflow, avoid unnecessary operations, use efficient data structures, and consider distributed or database-based processing when appropriate.
Challenge: Communication
Technical results may be difficult for managers or non-specialists to interpret.
Solution: Combine analytical accuracy with clear charts, concise explanations, and decision-focused reporting.
Case Study
Predictive maintenance for industrial equipment
Consider an industrial facility monitoring a fleet of pumps.
Each pump generates information about:
- Temperature
- Vibration
- Operating hours
- Pressure
- Flow rate
- Maintenance history
The engineering team initially stores the measurements in a database.
Python can be used to automatically retrieve the latest records and prepare them for analysis. A machine-learning workflow can then identify patterns associated with abnormal equipment behavior.
At the same time, R can be valuable for investigating historical failure patterns and determining which measurements have the strongest statistical relationships with maintenance events.
The organization therefore does not necessarily need to choose one language exclusively.
A practical hybrid architecture could look like:
Sensors
   ↓
Database
   ↓
Python Data Pipeline
   ↓
Predictive Model
   ↓
Results
   ↓
R Statistical Analysis
   ↓
Engineering Report
   ↓
Maintenance Decision
This illustrates an important principle: R and Python can complement each other rather than compete with each other.
Essential Tips
For beginners
Start with one language rather than trying to master both simultaneously.
If you want broad programming, automation, AI, and engineering integration, Python is an excellent starting point.
If your primary objective is statistical analysis, research, and data visualization, R can be an excellent first choice.
For engineering students
Do not focus exclusively on programming syntax.
Develop four skills together:
Programming + Statistics + Domain Knowledge + Communication
That combination is considerably more valuable than memorizing hundreds of commands.
For professionals
Choose tools based on the complete workflow.
Ask:
- Where does the data originate?
- How large is it?
- Who will use the results?
- Does the analysis need automation?
- Will a machine-learning model be deployed?
- Is statistical interpretation the primary goal?
- Does the organization already have an established technology stack?
For advanced users
Consider learning both.
An engineer who understands both R and Python can select the most appropriate tool for different stages of an analytical project.
This can also improve collaboration between statisticians, data scientists, researchers, software engineers, and domain specialists.
FAQs
Is R better than Python for data analysis?
Not universally. R is exceptionally strong in statistics, research, and analytical visualization, while Python provides broader programming, automation, machine learning, and engineering integration capabilities.
Is Python easier to learn than R?
Many beginners find Python easier because its syntax resembles conventional programming languages and it can be used across many technical fields. However, learners focused specifically on statistics may find R’s analytical approach very productive.
Can R perform machine learning?
Yes. R has extensive machine-learning capabilities and numerous packages for classification, regression, clustering, and other predictive techniques.
Can Python perform statistical analysis?
Absolutely. Python provides powerful statistical functionality through libraries designed for scientific computing and statistical modeling.
Should engineering students learn Python or R?
For most engineering students, Python is a strong first choice because it combines data analysis with automation, scientific computing, machine learning, and general-purpose programming. R is worth learning when statistical research becomes an important part of the student’s work.
Can R and Python be used together?
Yes. Organizations frequently combine technologies. One language may handle a particular analytical task while another manages automation, deployment, visualization, or statistical reporting.
Which language is better for AI?
Python currently has a major advantage in AI development because of its extensive ecosystem for machine learning, deep learning, computer vision, natural language processing, and model deployment.
Do I need advanced mathematics to learn R or Python?
You can begin data analysis without advanced mathematics. However, deeper statistical modeling and machine learning eventually require stronger knowledge of probability, statistics, linear algebra, and related mathematical concepts.
Conclusion
R and Python are both powerful tools for modern data analysis, but they reflect different strengths.
R excels in statistics, research-oriented analysis, and analytical visualization. Python excels in general-purpose programming, automation, machine learning, AI, and integration with engineering systems.
For beginners, Python offers a particularly versatile entry point into programming and data science. For statisticians and researchers, R remains an exceptionally capable analytical environment.
For experienced professionals, the most useful strategy may not be choosing one language permanently. Instead, understanding the strengths of both allows engineers and data scientists to build flexible workflows.
The real objective is not to become an expert in a particular programming language simply for its own sake. The objective is to transform raw data → reliable information → useful insight → better engineering decisions. ⚙️📊🐍
In modern engineering, that ability can be more important than the specific programming language used to achieve it.